How to change the colour and axis ranges of the plots
This guide shows you how to bring out a feature that is washed out or saturated at the default range.
Steps
Open
Plugins → Range Controller.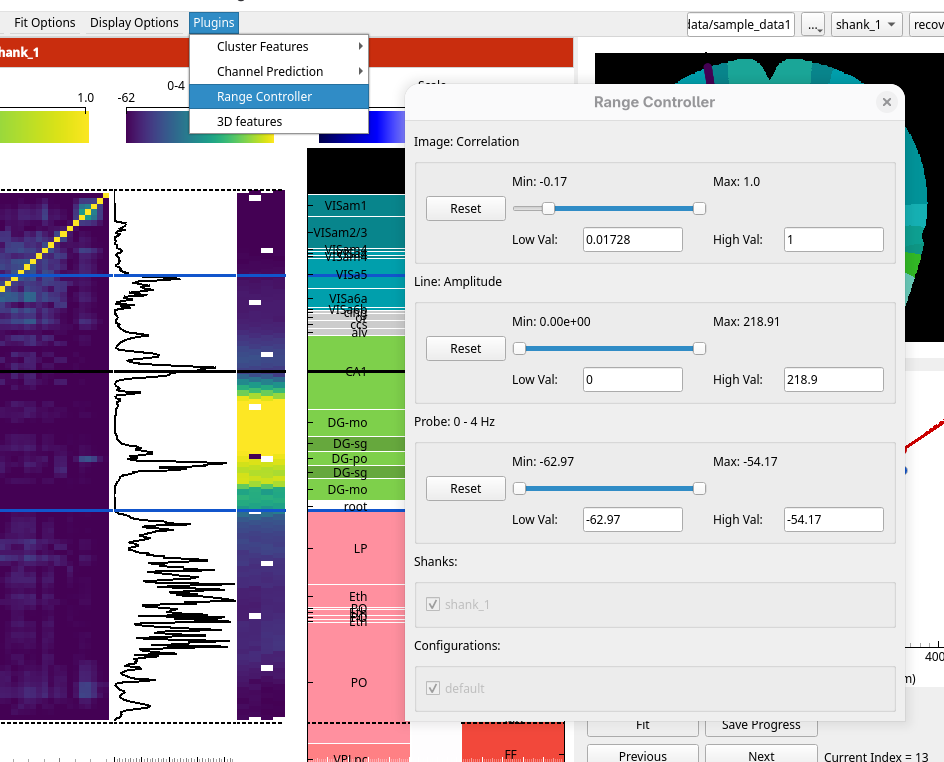
Drag the minimum and maximum sliders of the plot type, or type exact values in the boxes beside them:
image and probe plots: the colour scale
line plots: the x axis
With more than one shank or configuration, tick the shanks (or All) and configurations (or both) the ranges should apply to.
Click Reset beside a plot type to return it to its default range, or press R to reset every plot.