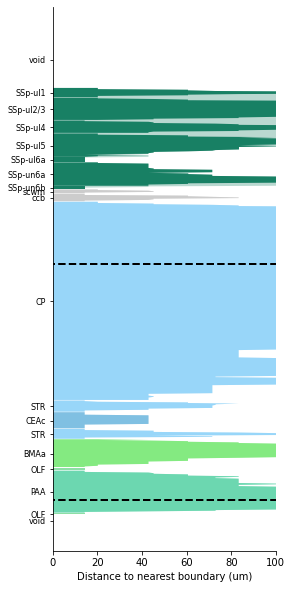
Distance to neighbouring region
Creates a plot of the regions through which a probe trajectory passes through. The x axis of the plot gives an indication of the distance of each point along the trajectory to the neighbouring region. From this one can infer how close the prove was to the edge of each structure. Additionally it plots the parent regions to show the distance to the edge of the allen atlas parent of each structure
[1]:
# Author: Mayo Faulkner
# import modules
from pathlib import Path

import numpy as np
import matplotlib.pyplot as plt
from one.api import ONE
import one.alf.io as alfio

from ibllib.pipes.ephys_alignment import EphysAlignment
from ibllib.atlas import atlas


# Instantiate brain atlas and one
brain_atlas = atlas.AllenAtlas(25)
one = ONE(base_url='https://openalyx.internationalbrainlab.org')

# Find eid of interest
subject = 'CSH_ZAD_029'
date = '2020-09-19'
sess_no = 1
probe_label = 'probe01'
eid = one.search(subject=subject, date=date, number=sess_no)[0]

# Find user traced points for this recording session
picks = one.alyx.rest('insertions', 'list', session=eid, name=probe_label)
xyz_picks = np.array(picks[0]['json']['xyz_picks']) / 1e6

# Instantiate EphysAlignment to find xyz coordinates and their depths along traced track
ephys_align = EphysAlignment(xyz_picks)
xyz_coords = ephys_align.xyz_samples
xyz_depths = ephys_align.sampling_trk
region_label = ephys_align.region_label

# Read in the allen structure tree csv
allen_path = Path(Path(atlas.__file__).parent, 'allen_structure_tree.csv')
allen = alfio.load_file_content(allen_path)

# Compute the distance to the closest neighbouring region for all xyz coordinates along probe track
nearby_bounds = ephys_align.get_nearest_boundary(xyz_coords, allen)

# Extract information and put into format for plotting
[struct_x, struct_y,
 struct_colour] = ephys_align.arrange_into_regions(xyz_depths, nearby_bounds['id'],
                                                   nearby_bounds['dist'],
                                                   nearby_bounds['col'])

# Also extract information for parents of the regions
[parent_x, parent_y,
 parent_colour] = ephys_align.arrange_into_regions(xyz_depths, nearby_bounds['parent_id'],
                                                   nearby_bounds['parent_dist'],
                                                   nearby_bounds['parent_col'])

# Create plot
fig, ax = plt.subplots(figsize=(4, 10))
# Plot for the actual structure
for x, y, col, in zip(struct_x, struct_y, struct_colour):
    ax.fill_between(x, y * 1e6, facecolor=col)
# Plot for the parent of structure (make transparent)
for x, y, col, in zip(parent_x, parent_y, parent_colour):
    ax.fill_between(x, y * 1e6, facecolor=col, alpha=0.3)

ax.set_yticks((region_label[:, 0] * 1e6).astype(int))
ax.set_yticklabels(region_label[:, 1])
ax.yaxis.set_tick_params(labelsize=8)
ax.spines['right'].set_visible(False)
ax.spines['top'].set_visible(False)
ax.hlines([0, 3840], *ax.get_xlim(), linestyles='dashed', linewidth=2, colors='k')
ax.set_xlim(0, 100)
ax.set_xlabel('Distance to nearest boundary (um)')
plt.show()