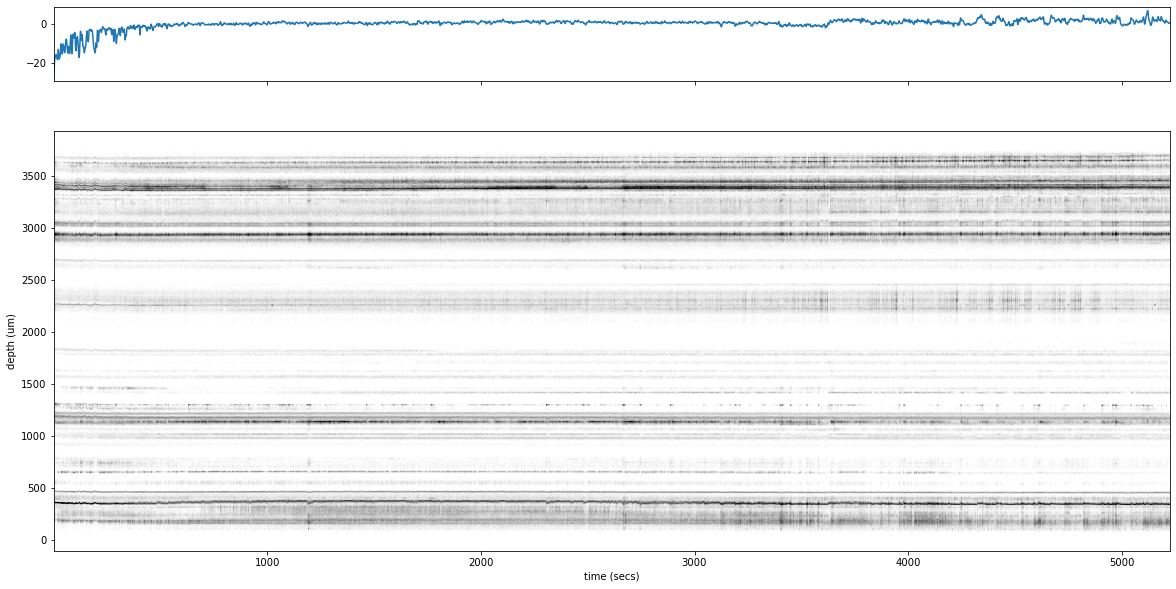
Download data and plot drift over the session
Downloads LFP power spectrum for a given session and probe and plots a heatmap of power spectrum on the channels along probe against frequency
[1]:
# import modules
from one.api import ONE
from brainbox.metrics import electrode_drift

# instantiate one
one = ONE(base_url='https://openalyx.internationalbrainlab.org', silent=True)

# Specify subject, date and probe we are interested in
subject = 'CSHL049'
date = '2020-01-08'
sess_no = 1
probe_label = 'probe00'
eid = one.search(subject=subject, date=date, number=sess_no)[0]

# Download and load the spikes data
spikes = one.load_object(eid, 'spikes', collection=f'alf/{probe_label}')

# Use brainbox function to compute drift over session
drift = electrode_drift.estimate_drift(spikes['times'], spikes['amps'], spikes['depths'],
                                       display=True)