Predicting brain regions from the electrophysiology
In this tutorial you will use three different channel prediction models on the probe from Your first alignment, to predict the brain region of each channel from the electrophysiology. You will compare their predictions with the histology and with each other, and use them to place your own reference lines.
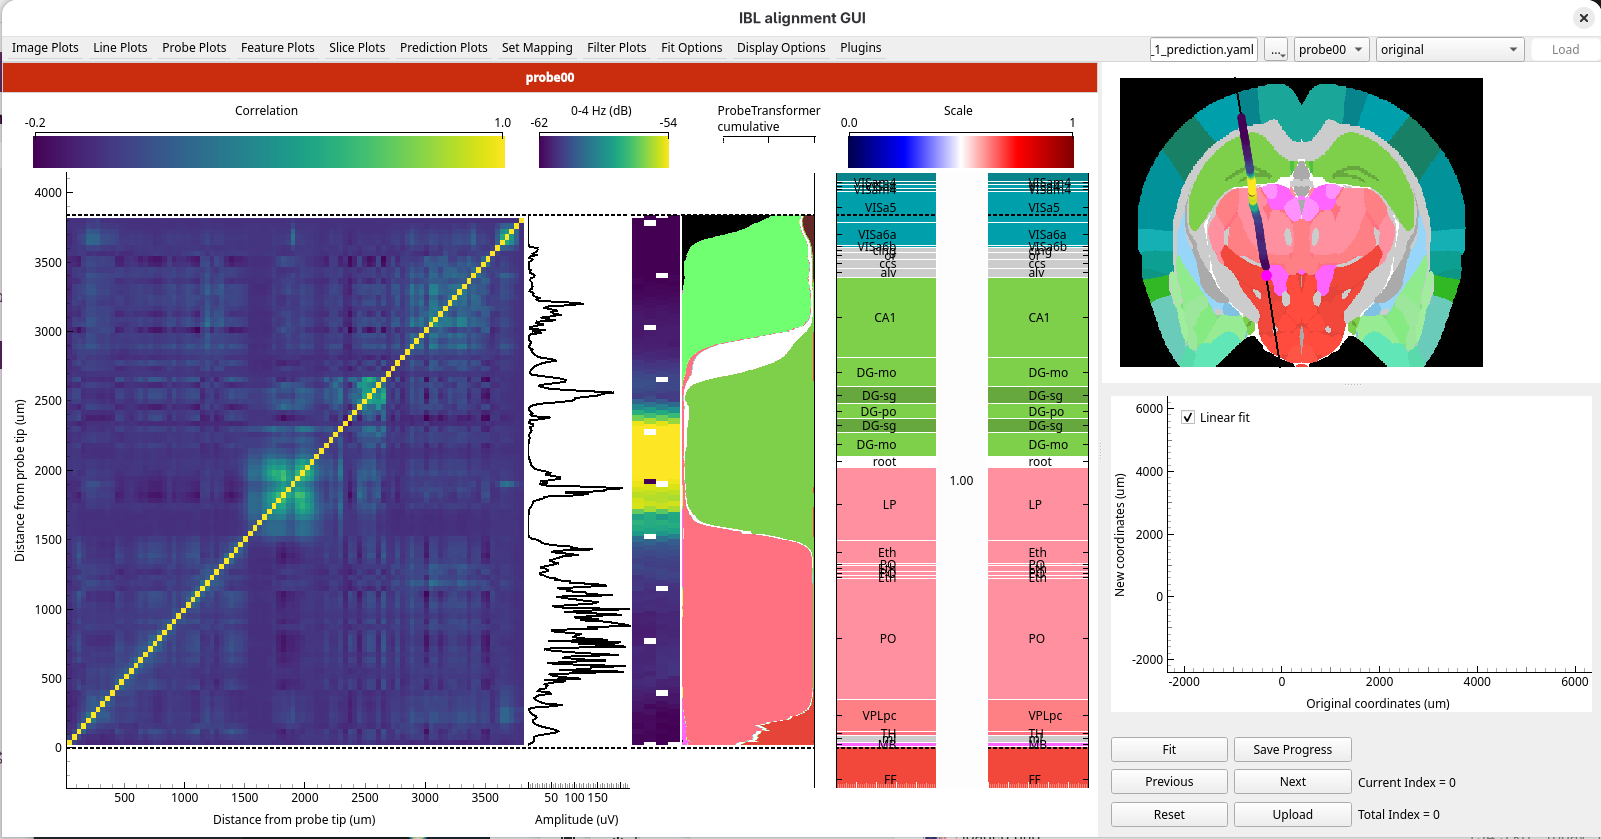
The models are downloaded the first time you use them, which can take a few minutes.
Before you start
Complete Your first alignment.
Install the
ephysatlasextra (see How to install the optional extras). It also installstorch, which the alignment model needs.Find the
sample_data_1_predictionfolder in the sample data you extracted for Your first alignment, next to thesample_data_1folder. It holds:ephys_atlas_features_2026_W42.pqt: the electrophysiology features of every channel of Sample data 1, computed from the raw data withibleatoolssample_data_1_prediction.yaml: a session YAML that loads Sample data 1 with these features
1. Check the plugin is installed
Start the GUI with
alignment-gui.Open the
Pluginsmenu. It has aChannel Predictionentry, greyed out until you load a session with features in the next step.
If you do not see Channel Prediction as an option, the ephysatlas extra is not installed in
the environment you started the GUI from.
2. Load the data with its features
The features are given to the GUI in a session YAML, alongside the data you opened in Your first alignment.
Open
sample_data_1_prediction.yamlin a text editor:path: /path/to/ephys_alignment_sample_data probes: probe00: datasets: # The recording, histology and alignments of Sample data 1 spike_sorting: path: sample_data_1 histology: path: sample_data_1 output: path: sample_data_1 # The features the models run on features: path: sample_data_1_prediction/ephys_atlas_features_2026_W42.pqt
Set
pathto the full path of the folder that holdssample_data_1andsample_data_1_prediction, and save the file.The other paths are relative to it. The spike sorting and histology come from
sample_data_1, and the trajectory and the RMS and power spectra are read from there too, because they are saved beside the spike sorting. The results are written tosample_data_1as well, so you carry on from your alignment in Your first alignment. Only the features come fromsample_data_1_prediction.In the GUI, click
..., choose Open session YAML…, and choosesample_data_1_prediction.yaml.
The data loads as before, and your alignment from Your first alignment is selected in
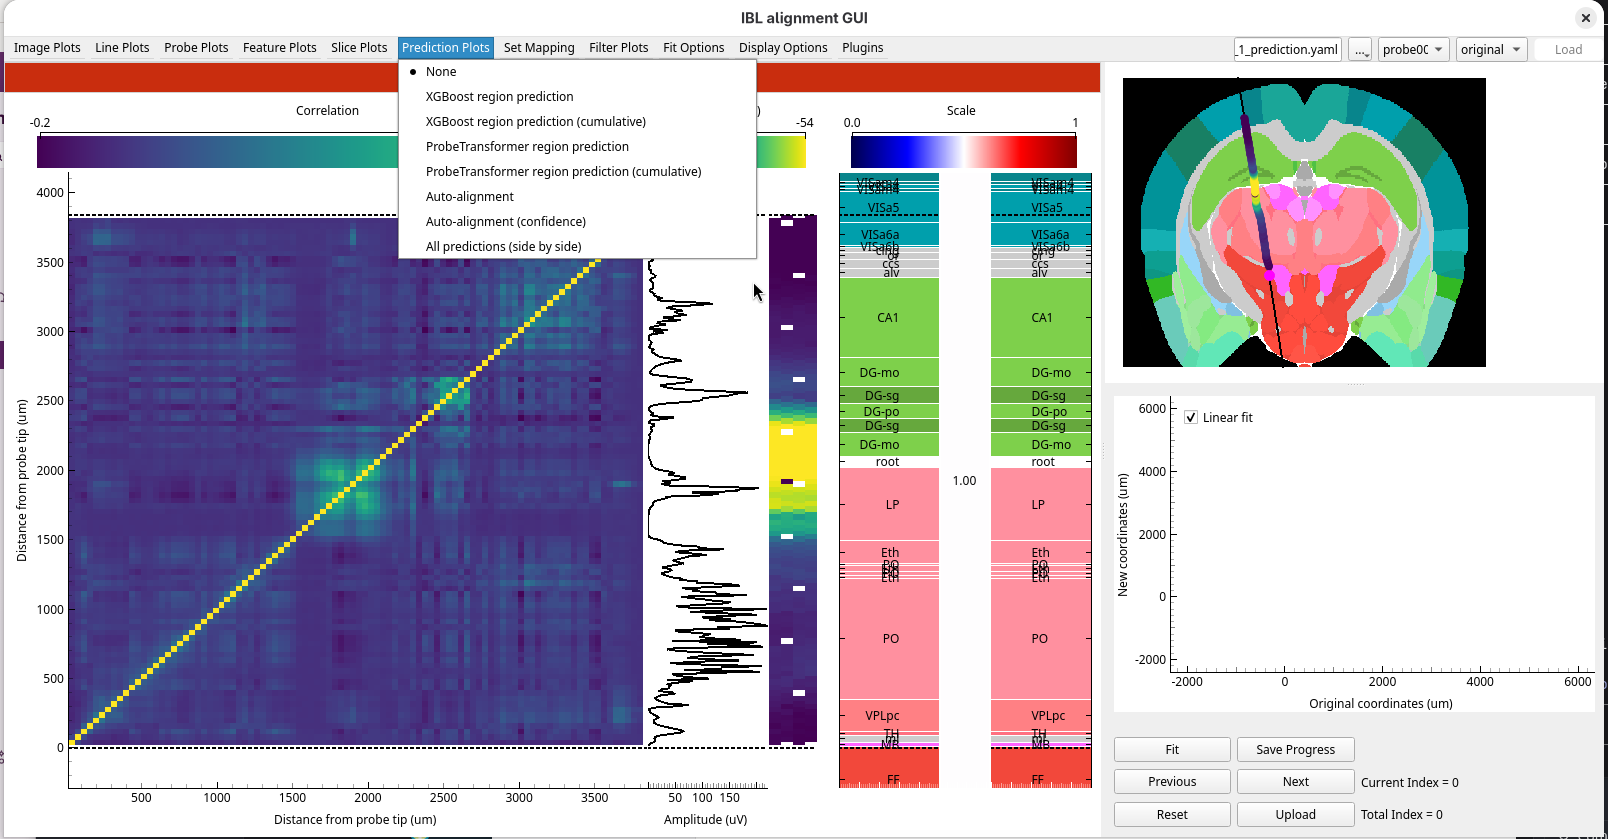
the alignment dropdown. With the features loaded, the Feature Plots and Prediction Plots menus
and Plugins → Channel Prediction are now available.
3. Look at the features
Open the
Feature Plotsmenu and chooseEphys Atlas. The ephys plots are replaced by every feature side by side, each normalised along the probe.
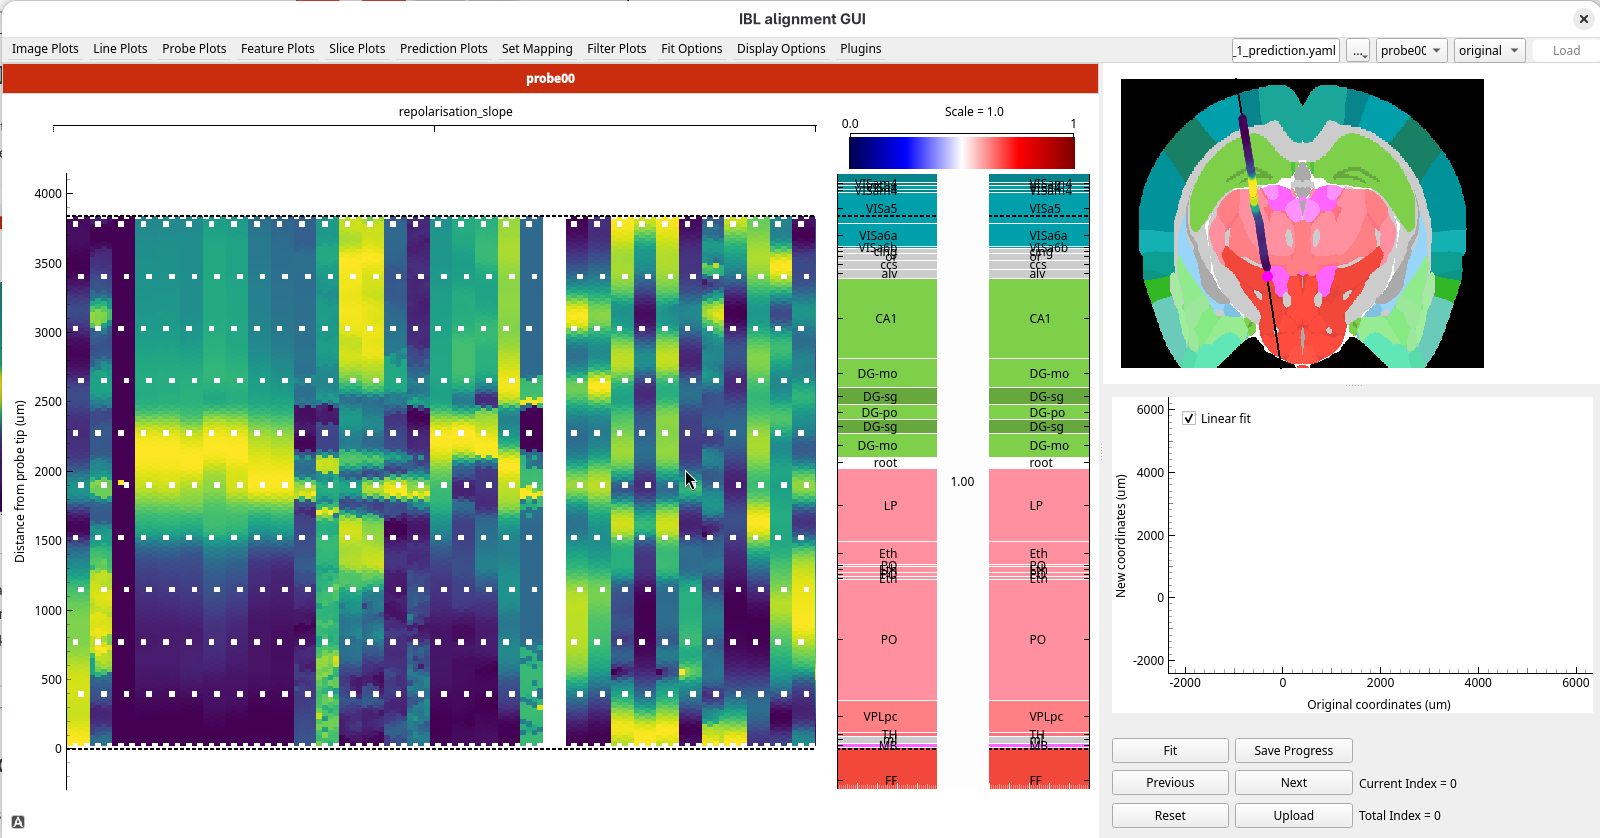
Look at where the features change along the probe. Many of them change together at the reference lines of your alignment from Your first alignment: at the top of the thalamus, at about 1500 µm, and at the top of CA1, at about 2700 µm.
These are the numbers the models work from: the same kinds of signal you looked at by eye in Your first alignment, computed for every channel. Choose any image plot to go back to the ephys plots.
4. Predict the regions with the region decoders
The first two models are region decoders: they predict the region of each channel directly from its electrophysiology features.
Choose
originalfrom the alignment dropdown, so the histology shows the track before any alignment.Open the
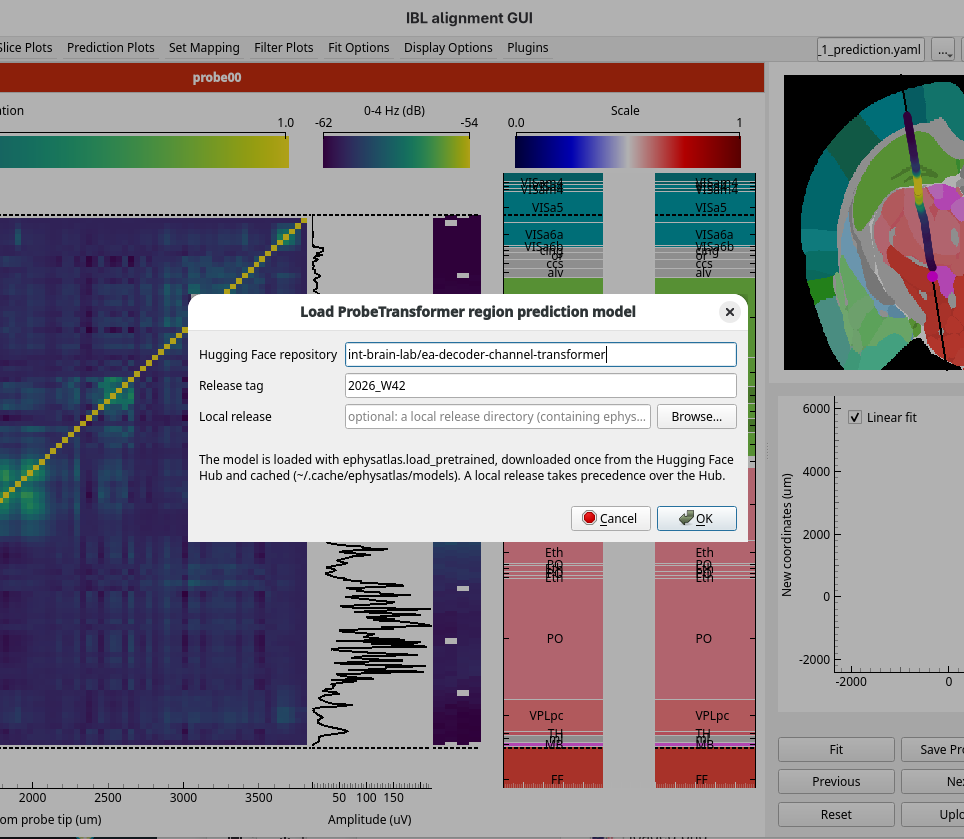
Prediction Plotsmenu and chooseProbeTransformer region prediction.The model’s dialog opens. Keep the default repository and release, and click OK. The model is downloaded the first time, then the prediction runs.
A panel titled ProbeTransformer prediction appears beside the ephys plots, showing the region the
model predicts for each channel from the electrophysiology alone. Each predicted region is labelled with its acronym.
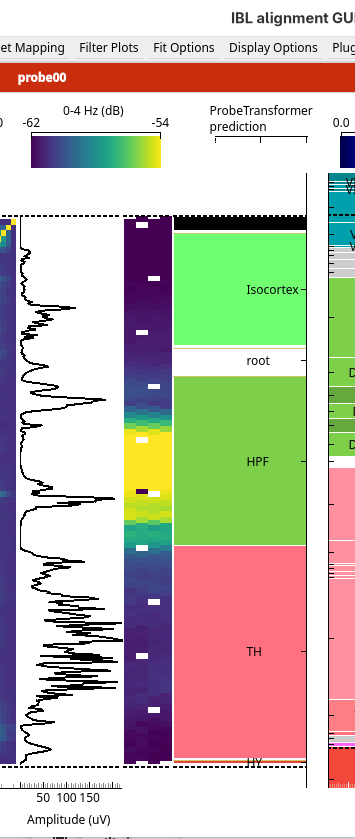
Compare the prediction with the regions in the Histology figure. The model predicts at a coarser level than the histology shows, so select
Cosmosfrom theSet Mappingmenu, or press Alt+M until it is selected, to show the histology with fewer, larger regions. SelectAllenagain before you go on.Choose
ProbeTransformer region prediction (cumulative). For each channel, it now shows the probability that the channel lies in each region, stacked side by side. Where one colour fills the width, the model is confident; where several share it, it is unsure.
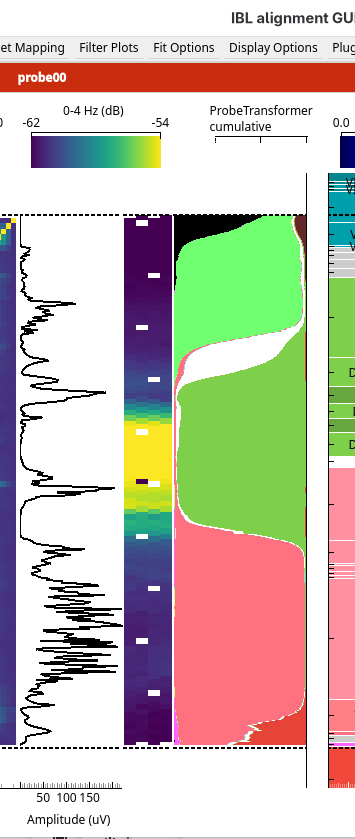
Choose
XGBoost region prediction, and load it in the same way. It is a second model, trained on the same features. You will compare the two in step 6.
5. Predict the regions with the alignment model
The third model works differently. It predicts the features expected at every point along the histology track, and aligns the recorded features to them. Each channel then takes the atlas region of the point on the track where it was placed.
Choose
Auto-alignmentfrom thePrediction Plotsmenu, and click OK in the model’s dialog.A progress dialog shows the alignment running. When it finishes, a result window opens.
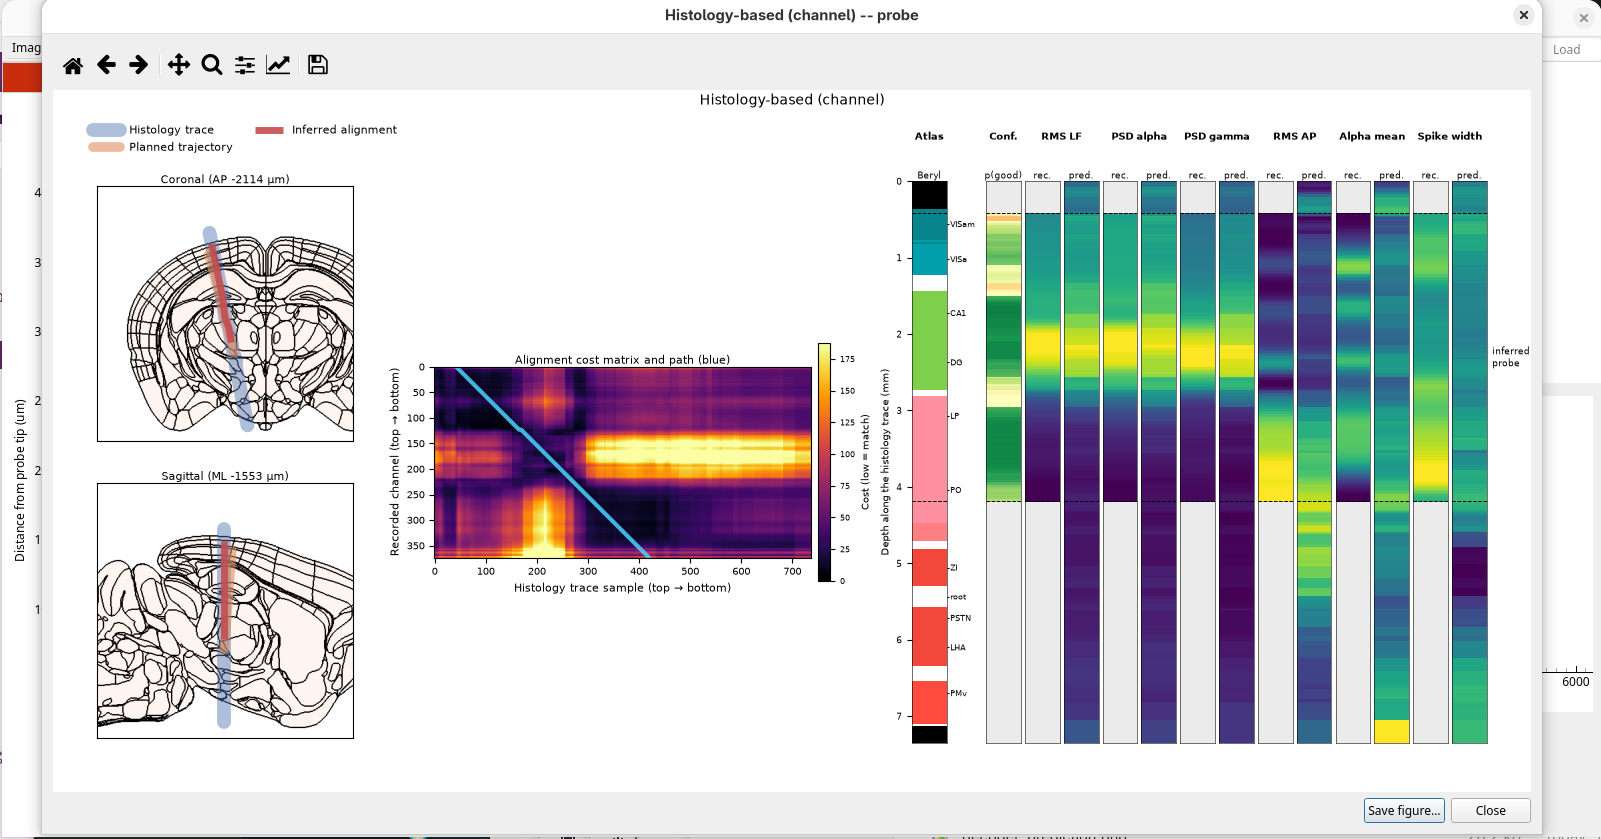
The result window shows how the model matched the recording to the track:
the track on coronal and sagittal slices, with the alignment it found
the cost matrix: every recorded channel against every point along the track, with the best path through it
stripes along the track: the atlas regions, the confidence, and the recorded and predicted features
Close the result window. Back in the main window, the prediction panel shows the atlas region of each channel where the alignment model placed it on the track.
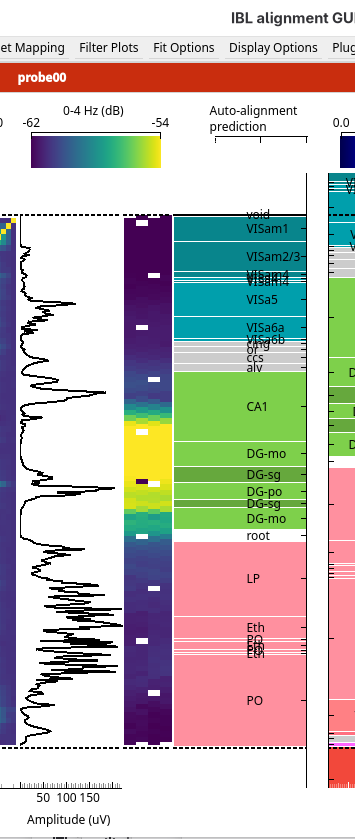
Choose
Auto-alignment (confidence)to see how confident the alignment is along the probe: green is high, red is low.
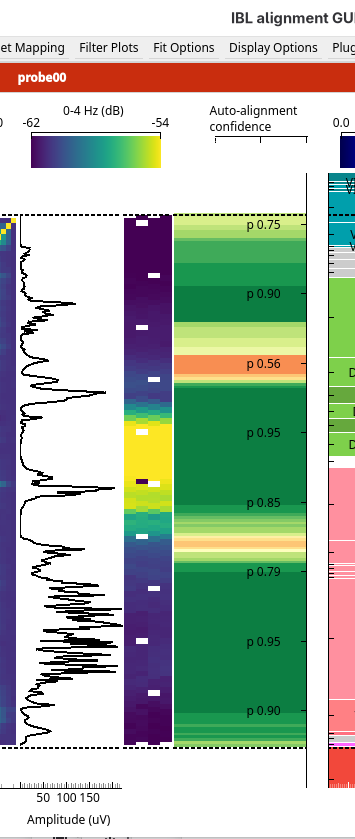
To see the result window again later, use Plugins → Channel Prediction → Show auto-alignment results.
6. Compare all the predictions
Press Shift+P. The ephys plots are replaced by every prediction side by side: the two region decoders, each with its cumulative probabilities, and the alignment model with its confidence.
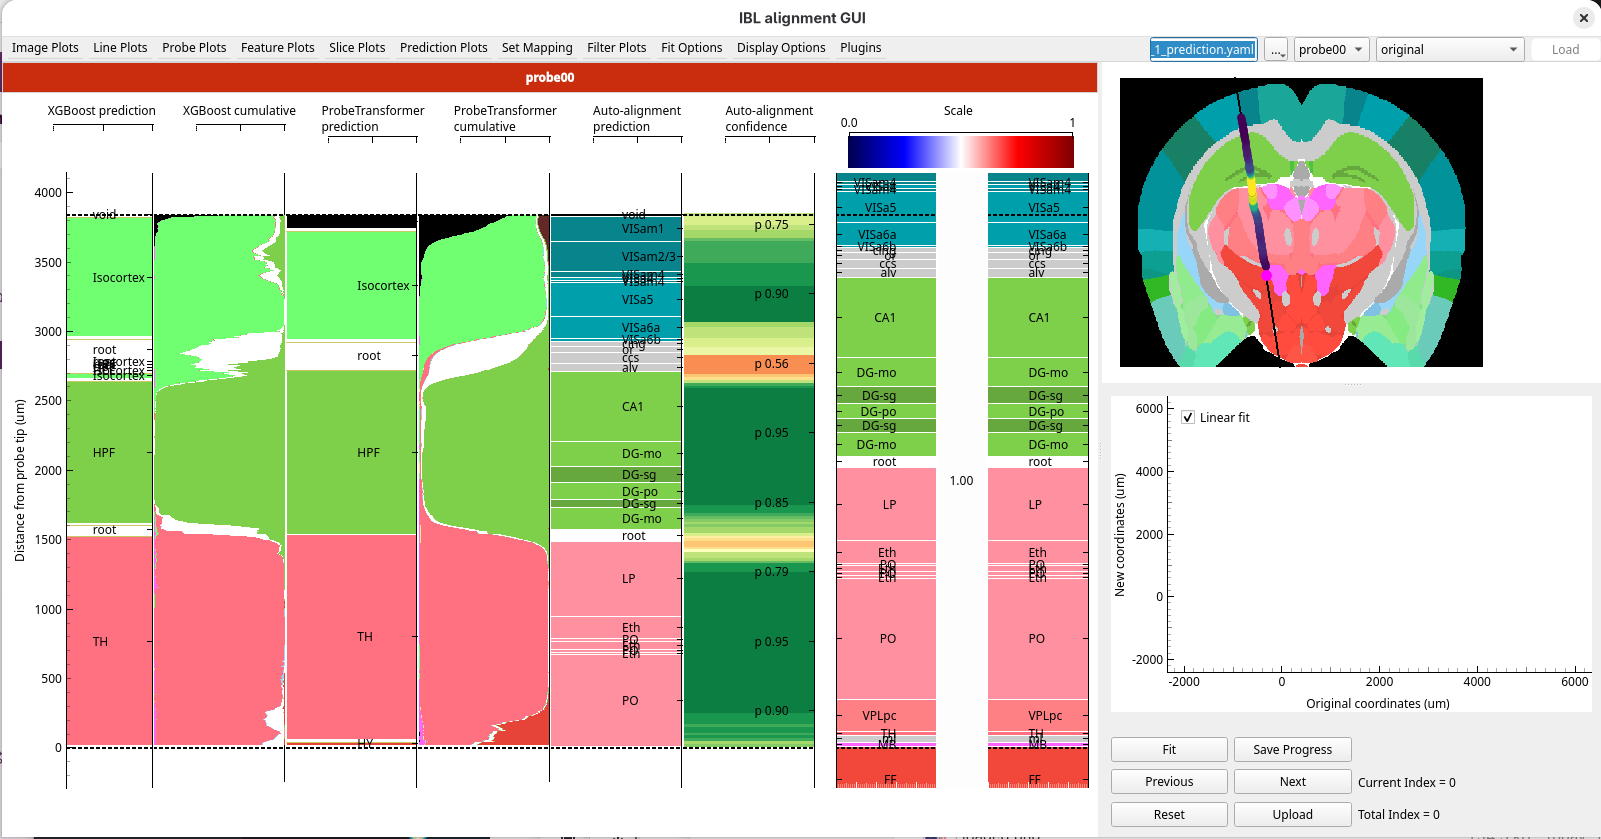
Compare the models. Boundaries that the models agree on, and that the alignment model is confident about, are the ones to trust most.
7. Use the predictions in your own alignment
The predictions do not change your alignment. They are a guide for placing reference lines, and you can place the lines in the all predictions view.
Add a reference line pair at each boundary the models agree on: the Ephys line on the predicted boundary, and the Histology line on the matching boundary in the Histology figure. Here they agree on three: the top of the brain, the boundary between the isocortex and the hippocampus, and the boundary between the hippocampus and the thalamus.
Press Enter to apply the fit.
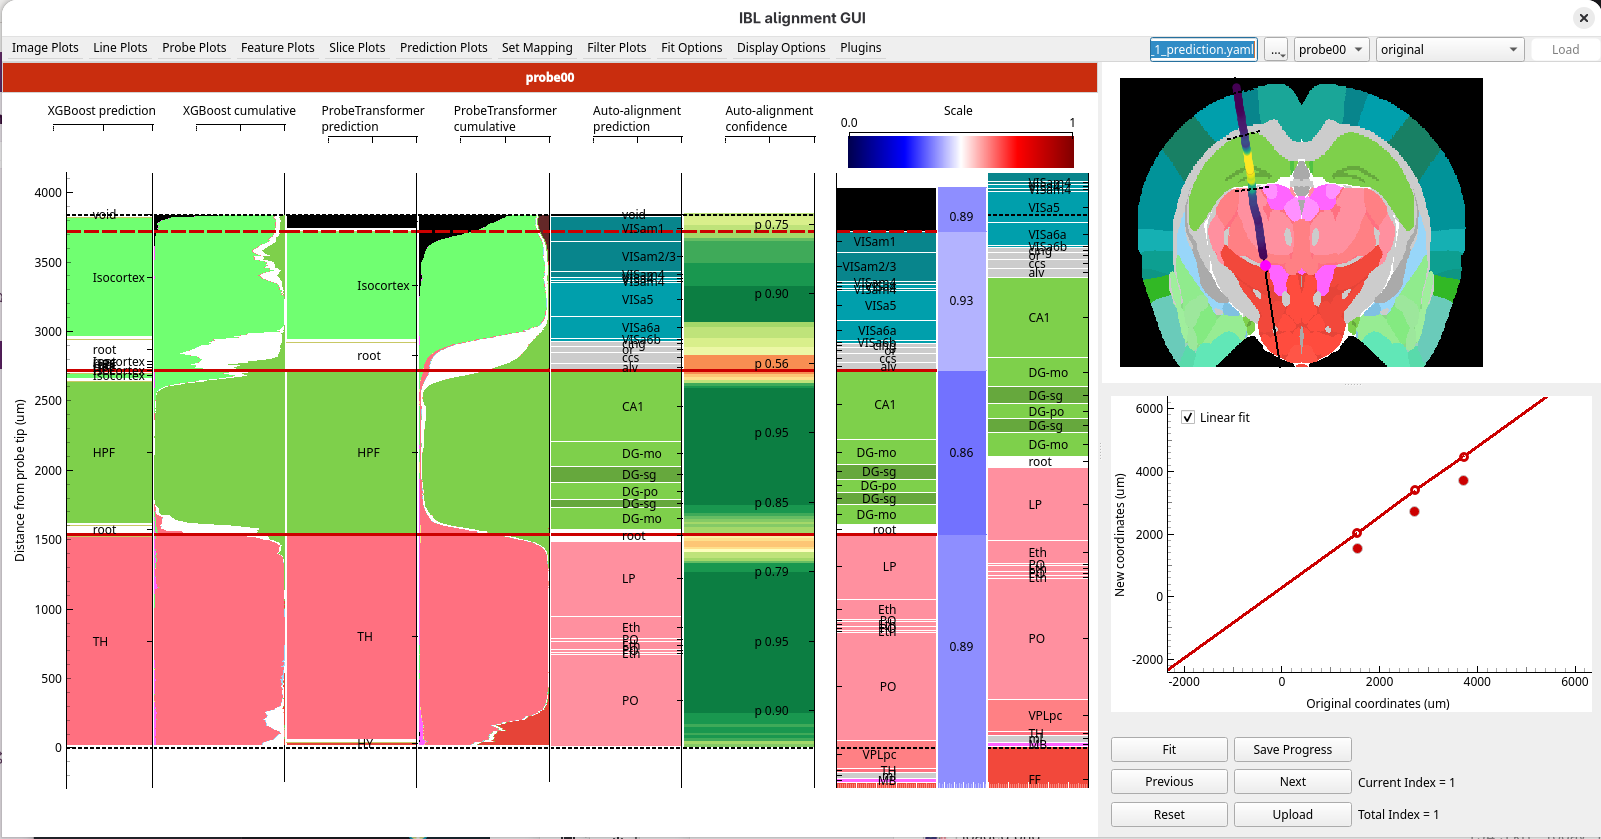
Choose any image plot to go back to the ephys plots, and check the alignment against the features you used in Your first alignment.
Upload with Shift+U when you are happy with it.
What you’ve learned
You have:
loaded a session and its features from a session YAML
predicted regions from the electrophysiology with three models, and compared them with the histology
read the confidence of a prediction
compared all the predictions side by side, and placed reference lines where they agree
Next steps
The channel prediction models: what the models do, and their limits
How to compute the features for a probe: compute features for your own recordings
How to use a specific model release: use a different model release