Benchmark gallery
Compression results across 11 IBL Neuropixels (NP1) recordings spanning a range of brain regions and recording quality. Each recording was compressed with two parameter sets:
| Label | ε | α | Typical CR |
|---|---|---|---|
| default | 150 | 28 | ~350× |
| aggressive | 450 | 96 | ~750× |
Click any figure to open it full-size with keyboard navigation.
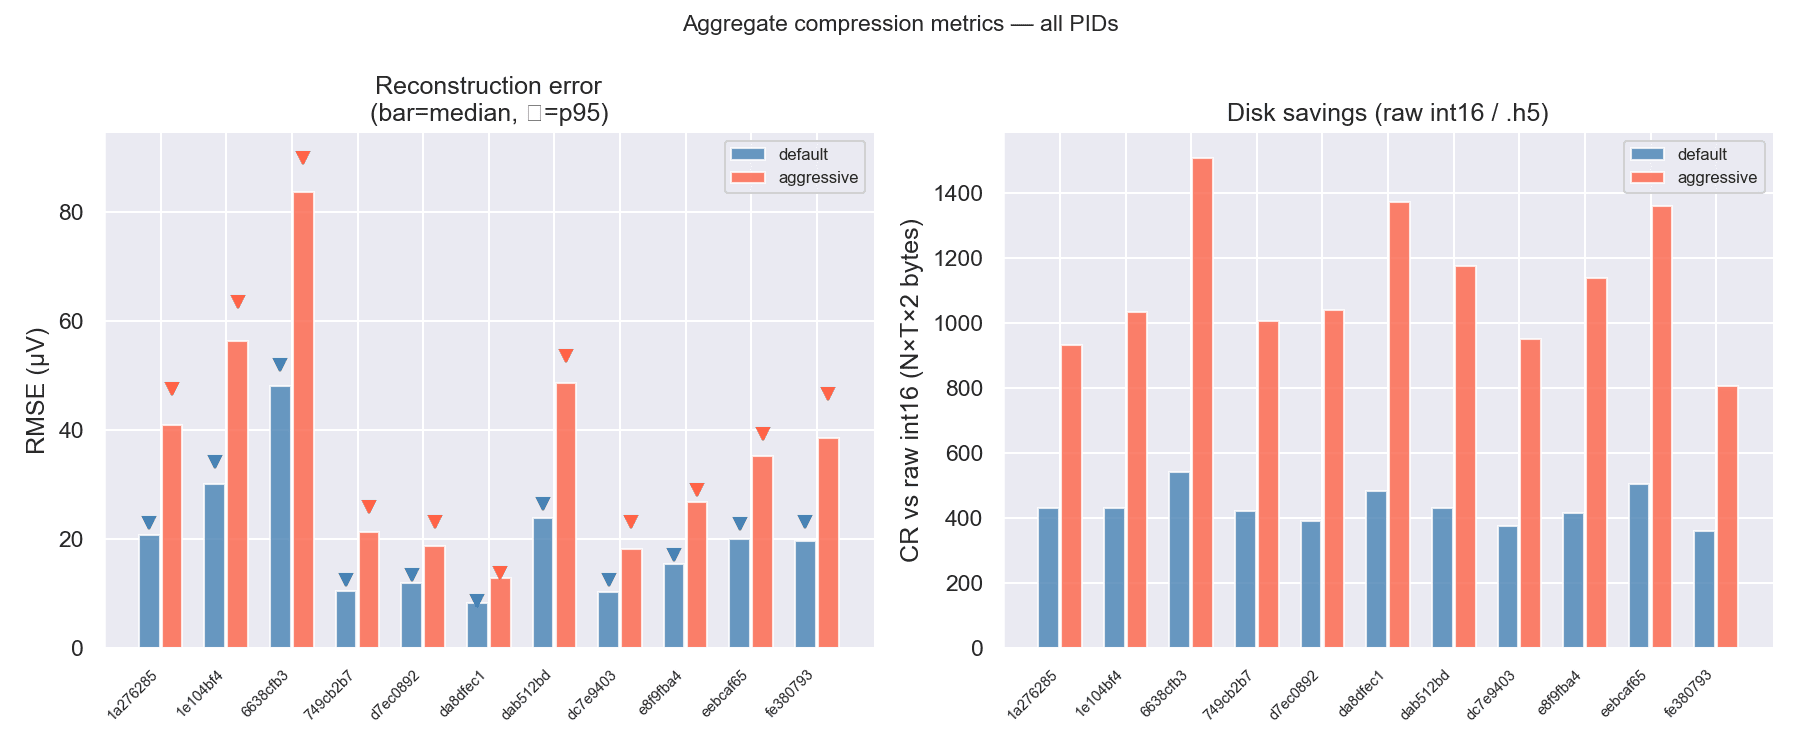
Aggregate metrics
RMSE distribution (bar = median, ▽ = p95) and compression ratio across all recordings.
Voltage density
Columns within each panel: original → Cadzow → default → aggressive (top row), with residuals vs the previous stage (bottom row).
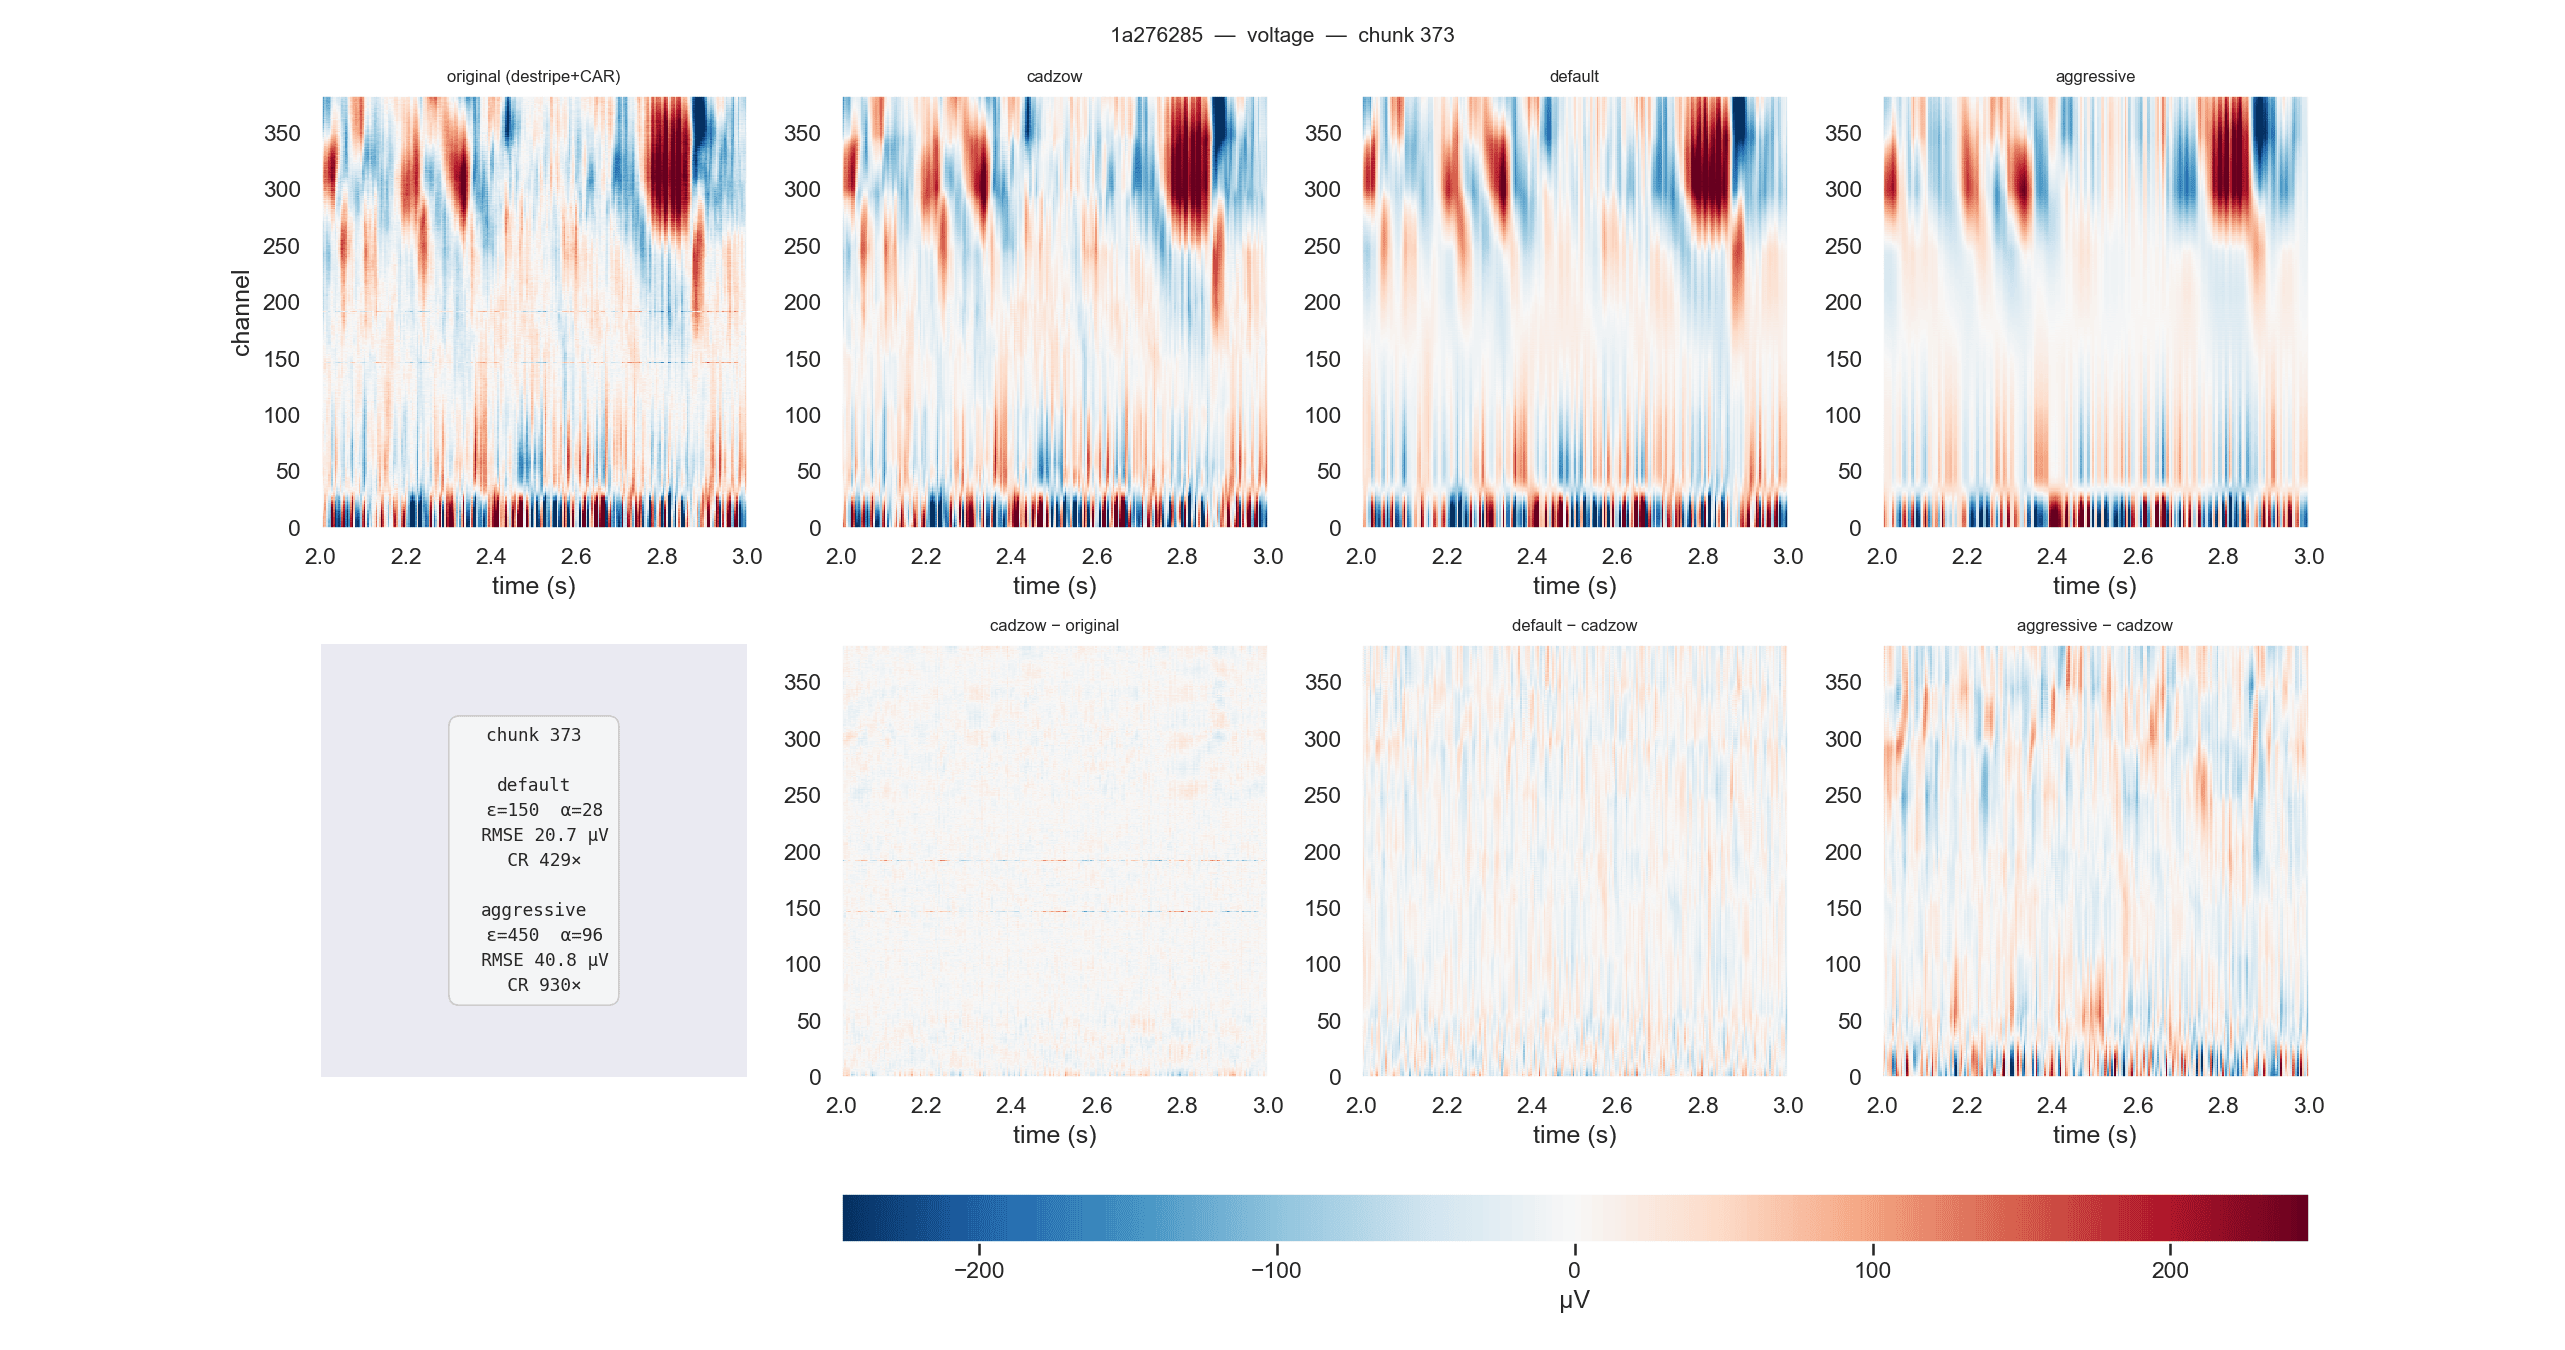
1a276285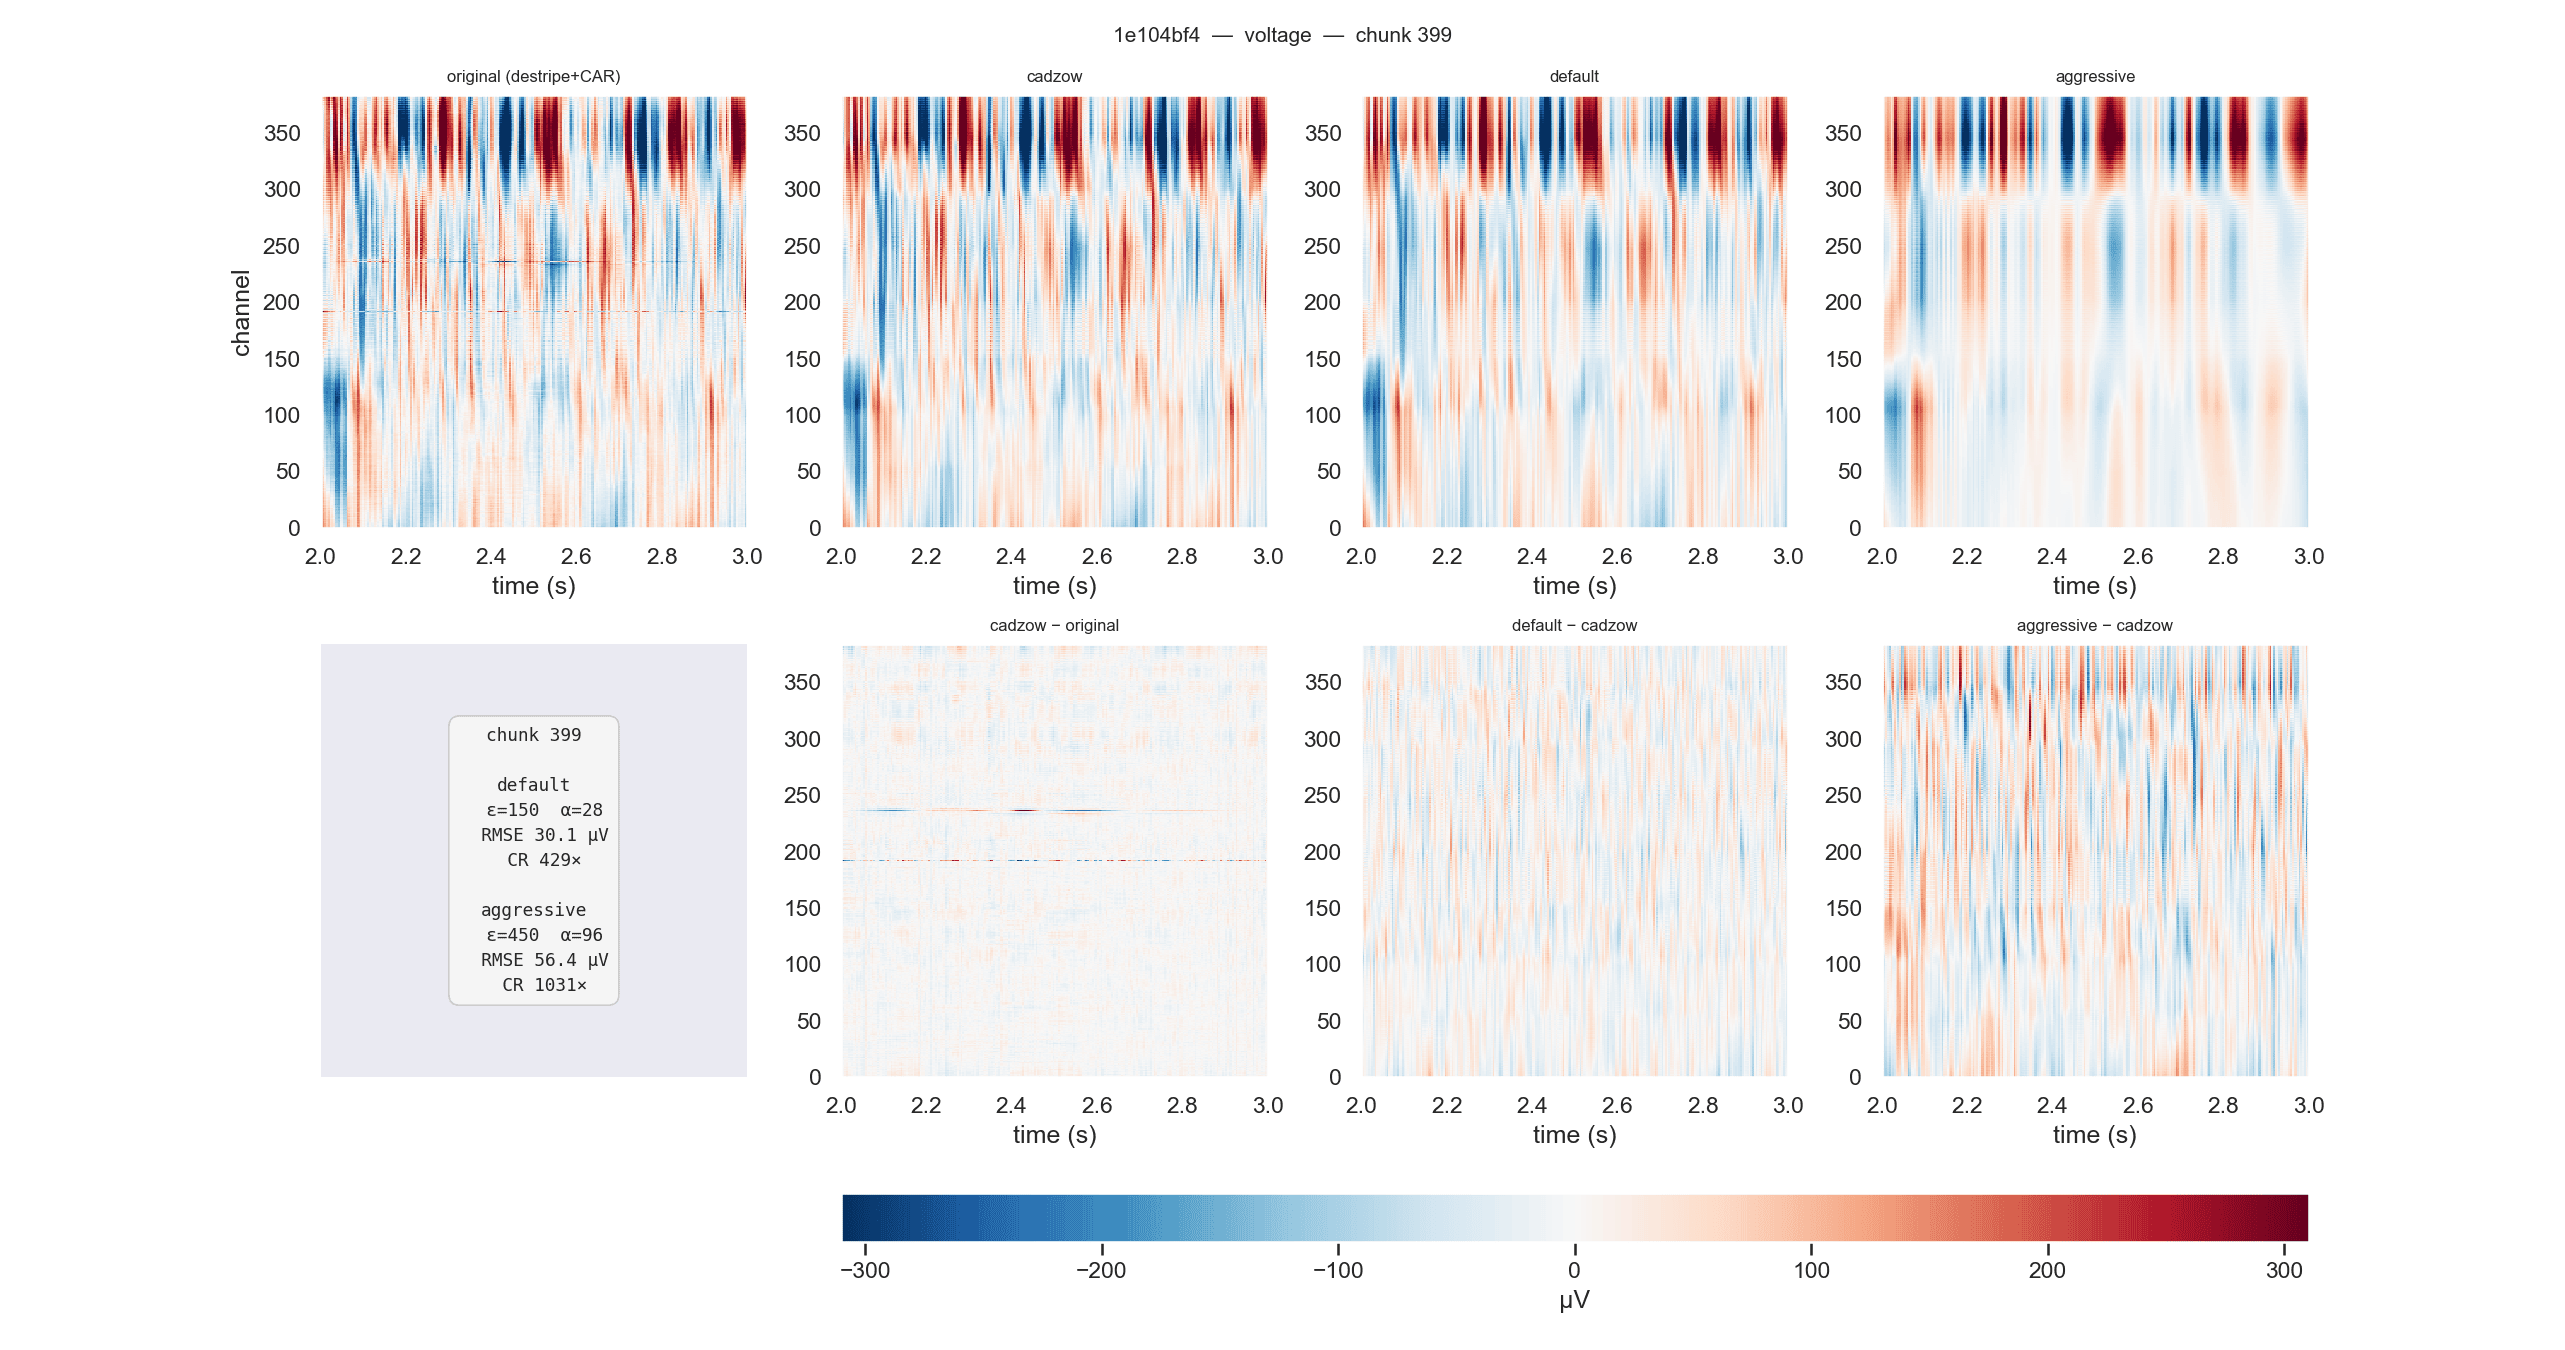
1e104bf4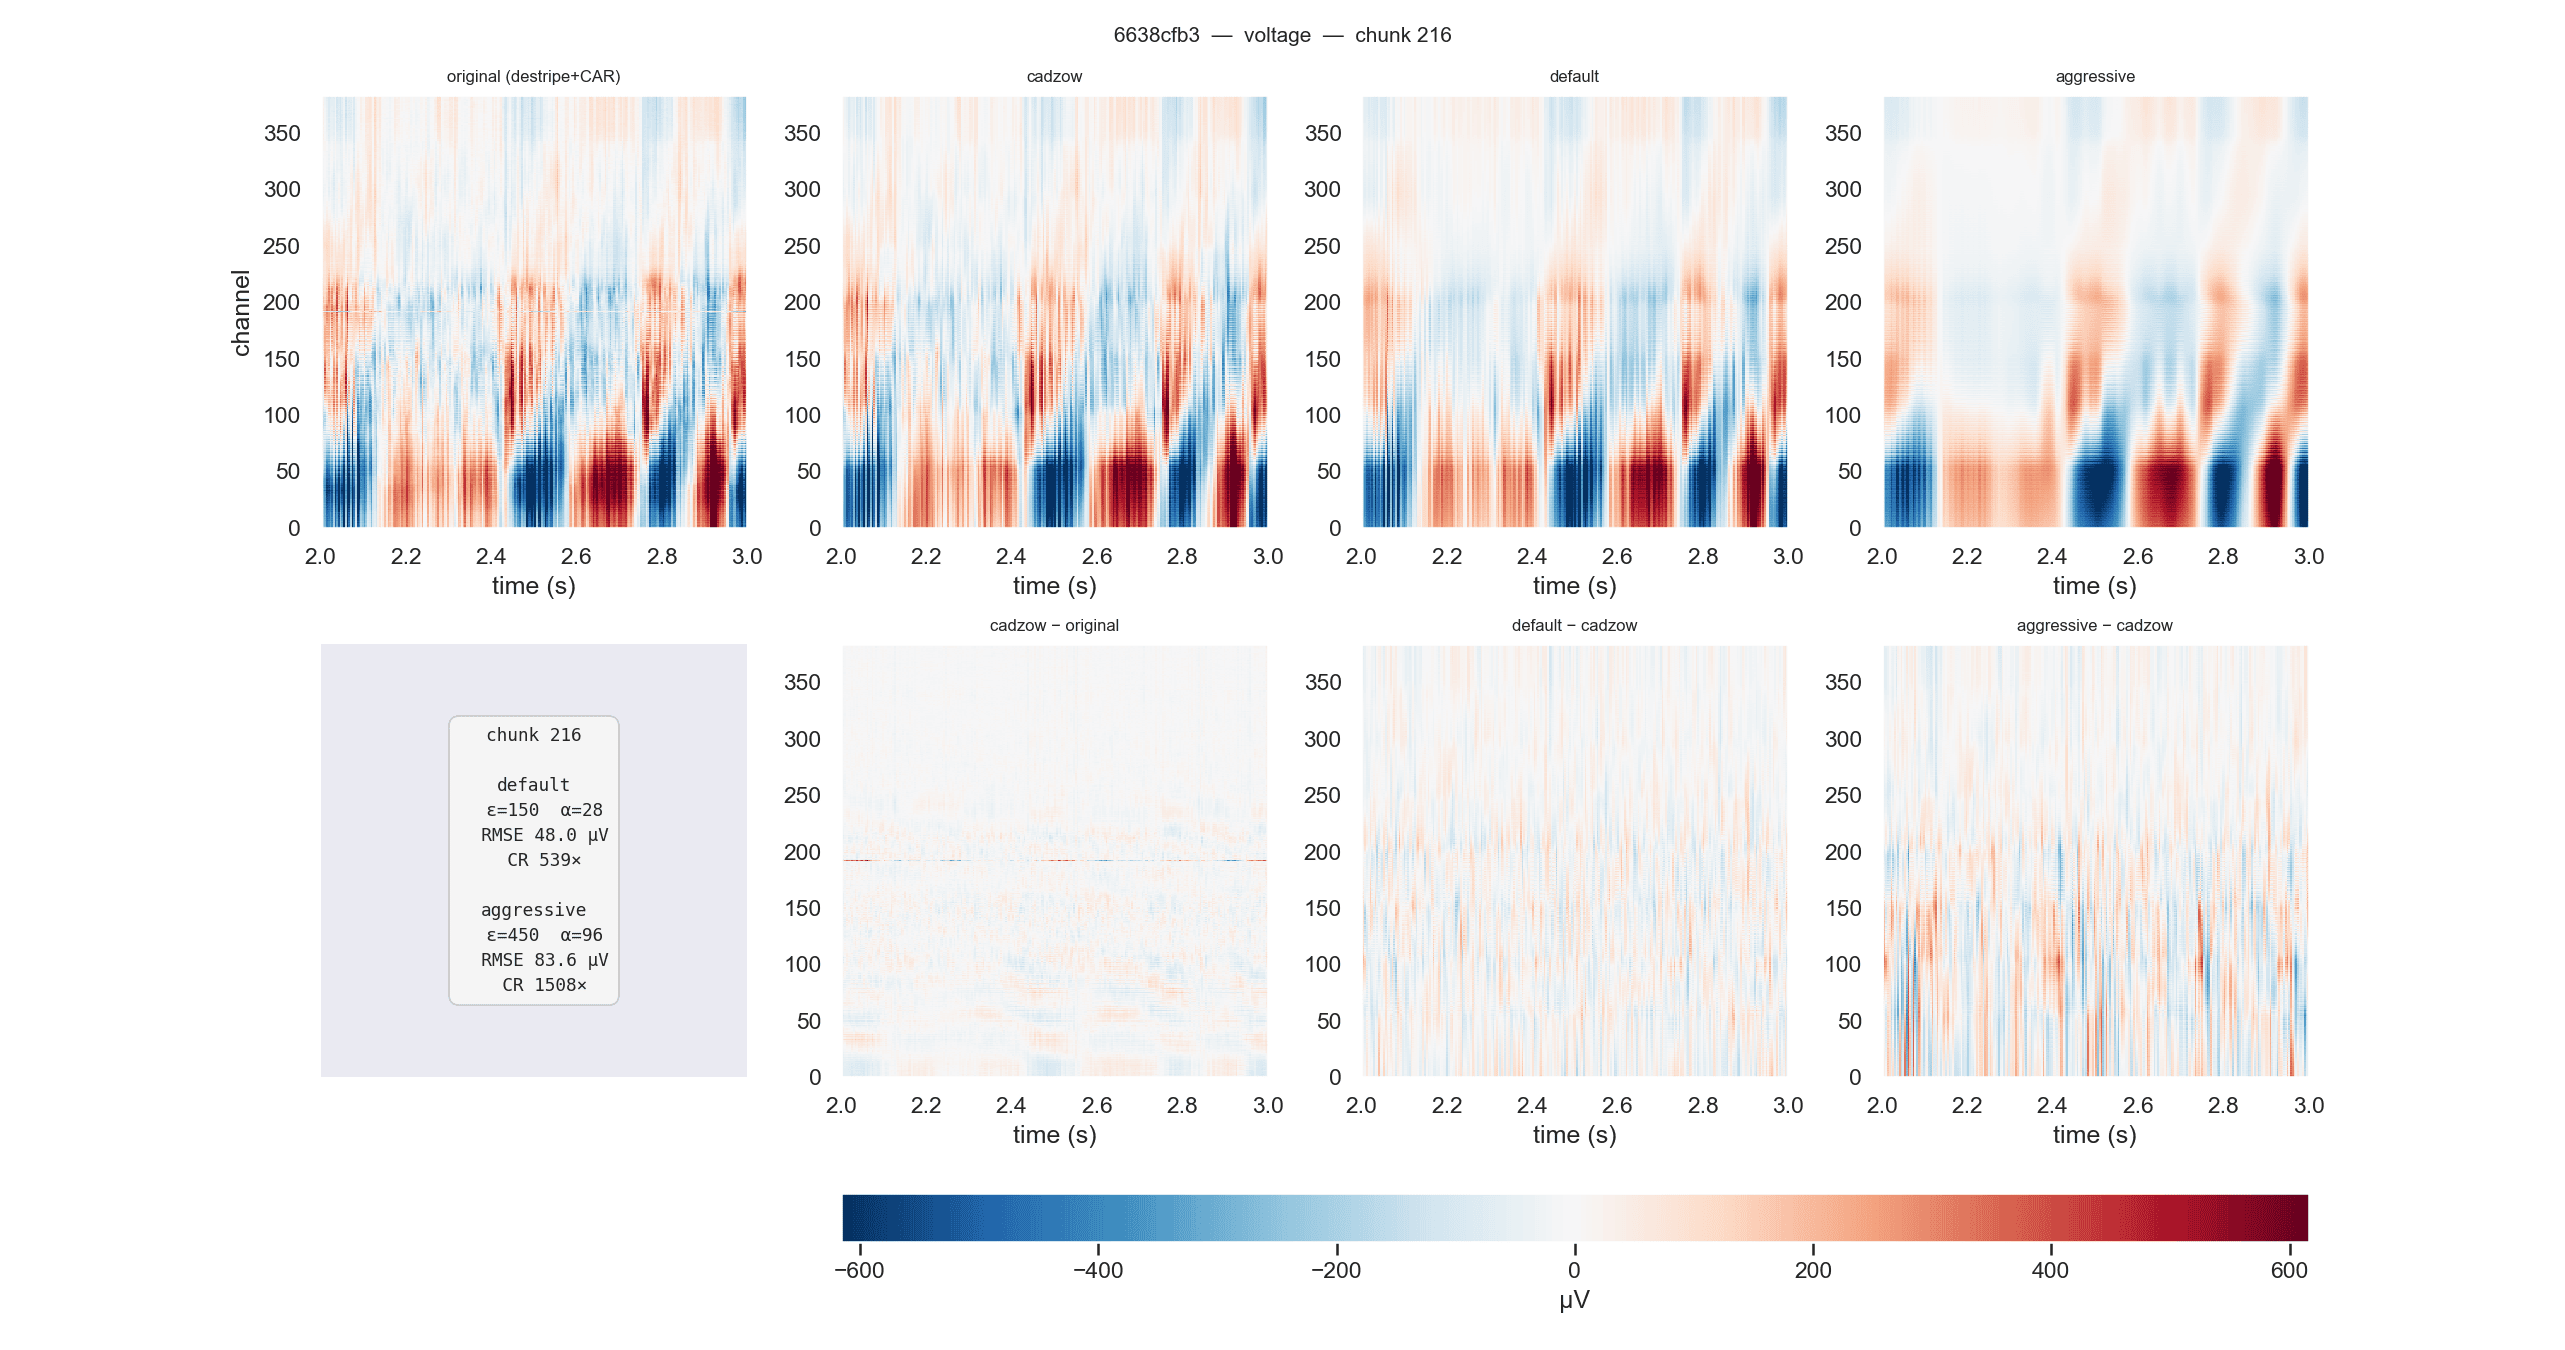
6638cfb3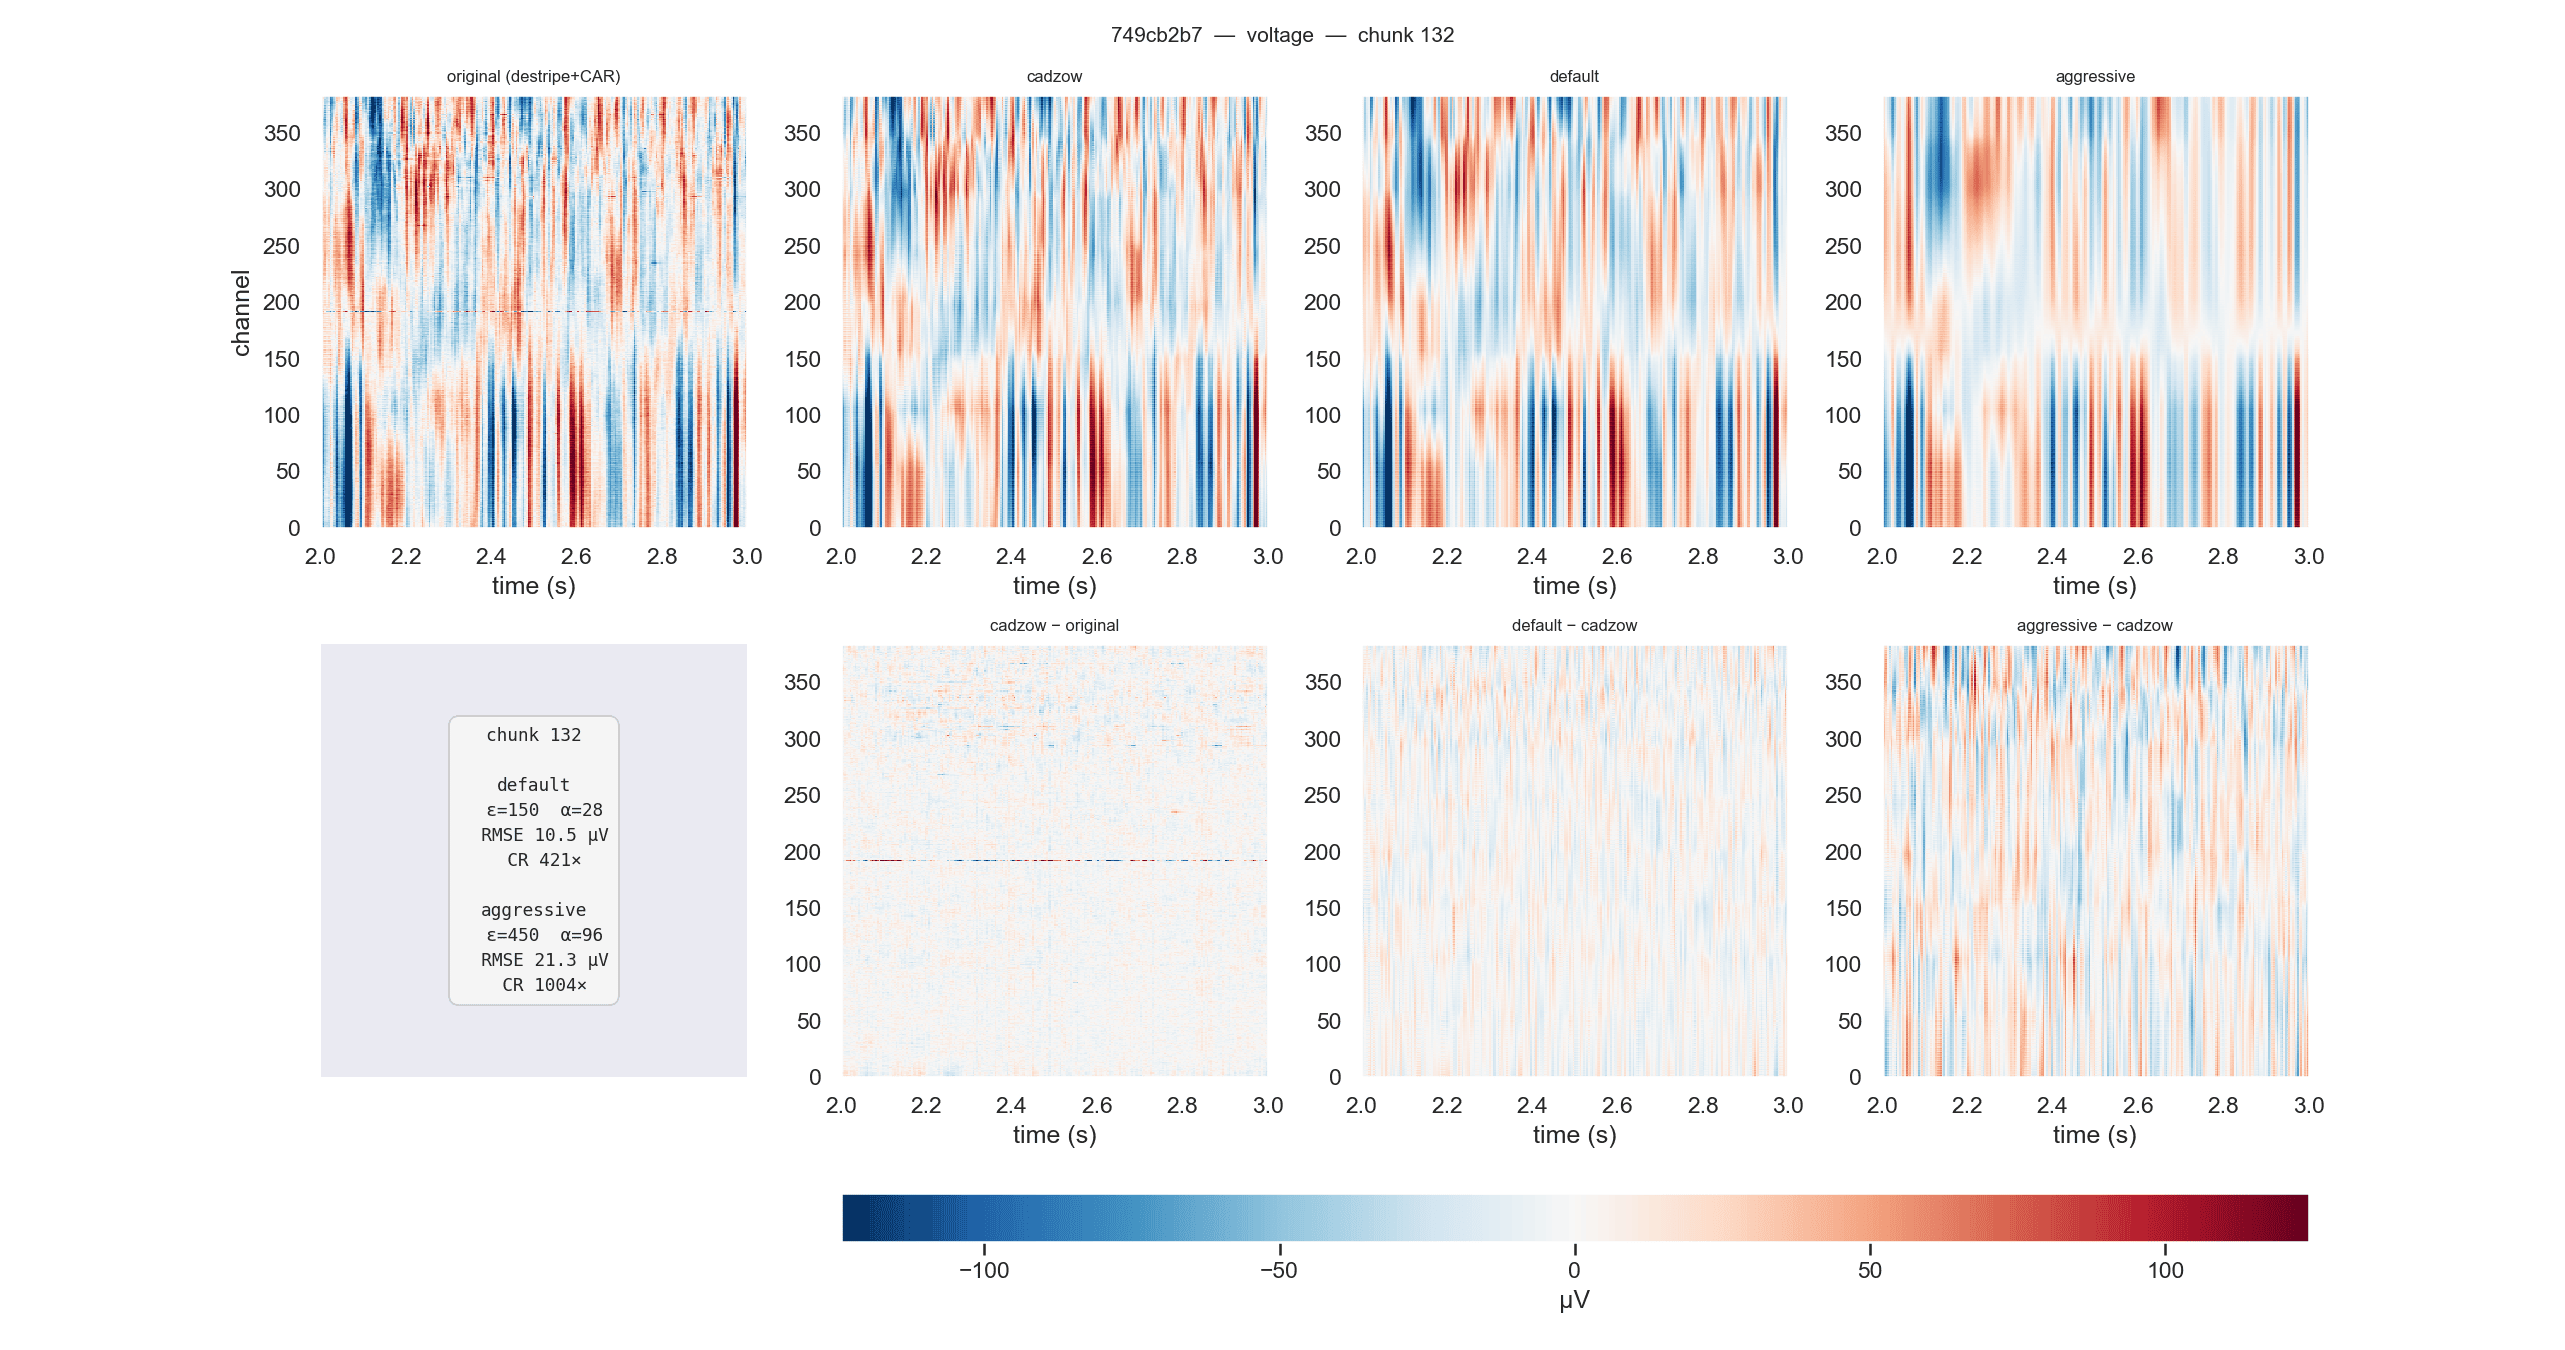
749cb2b7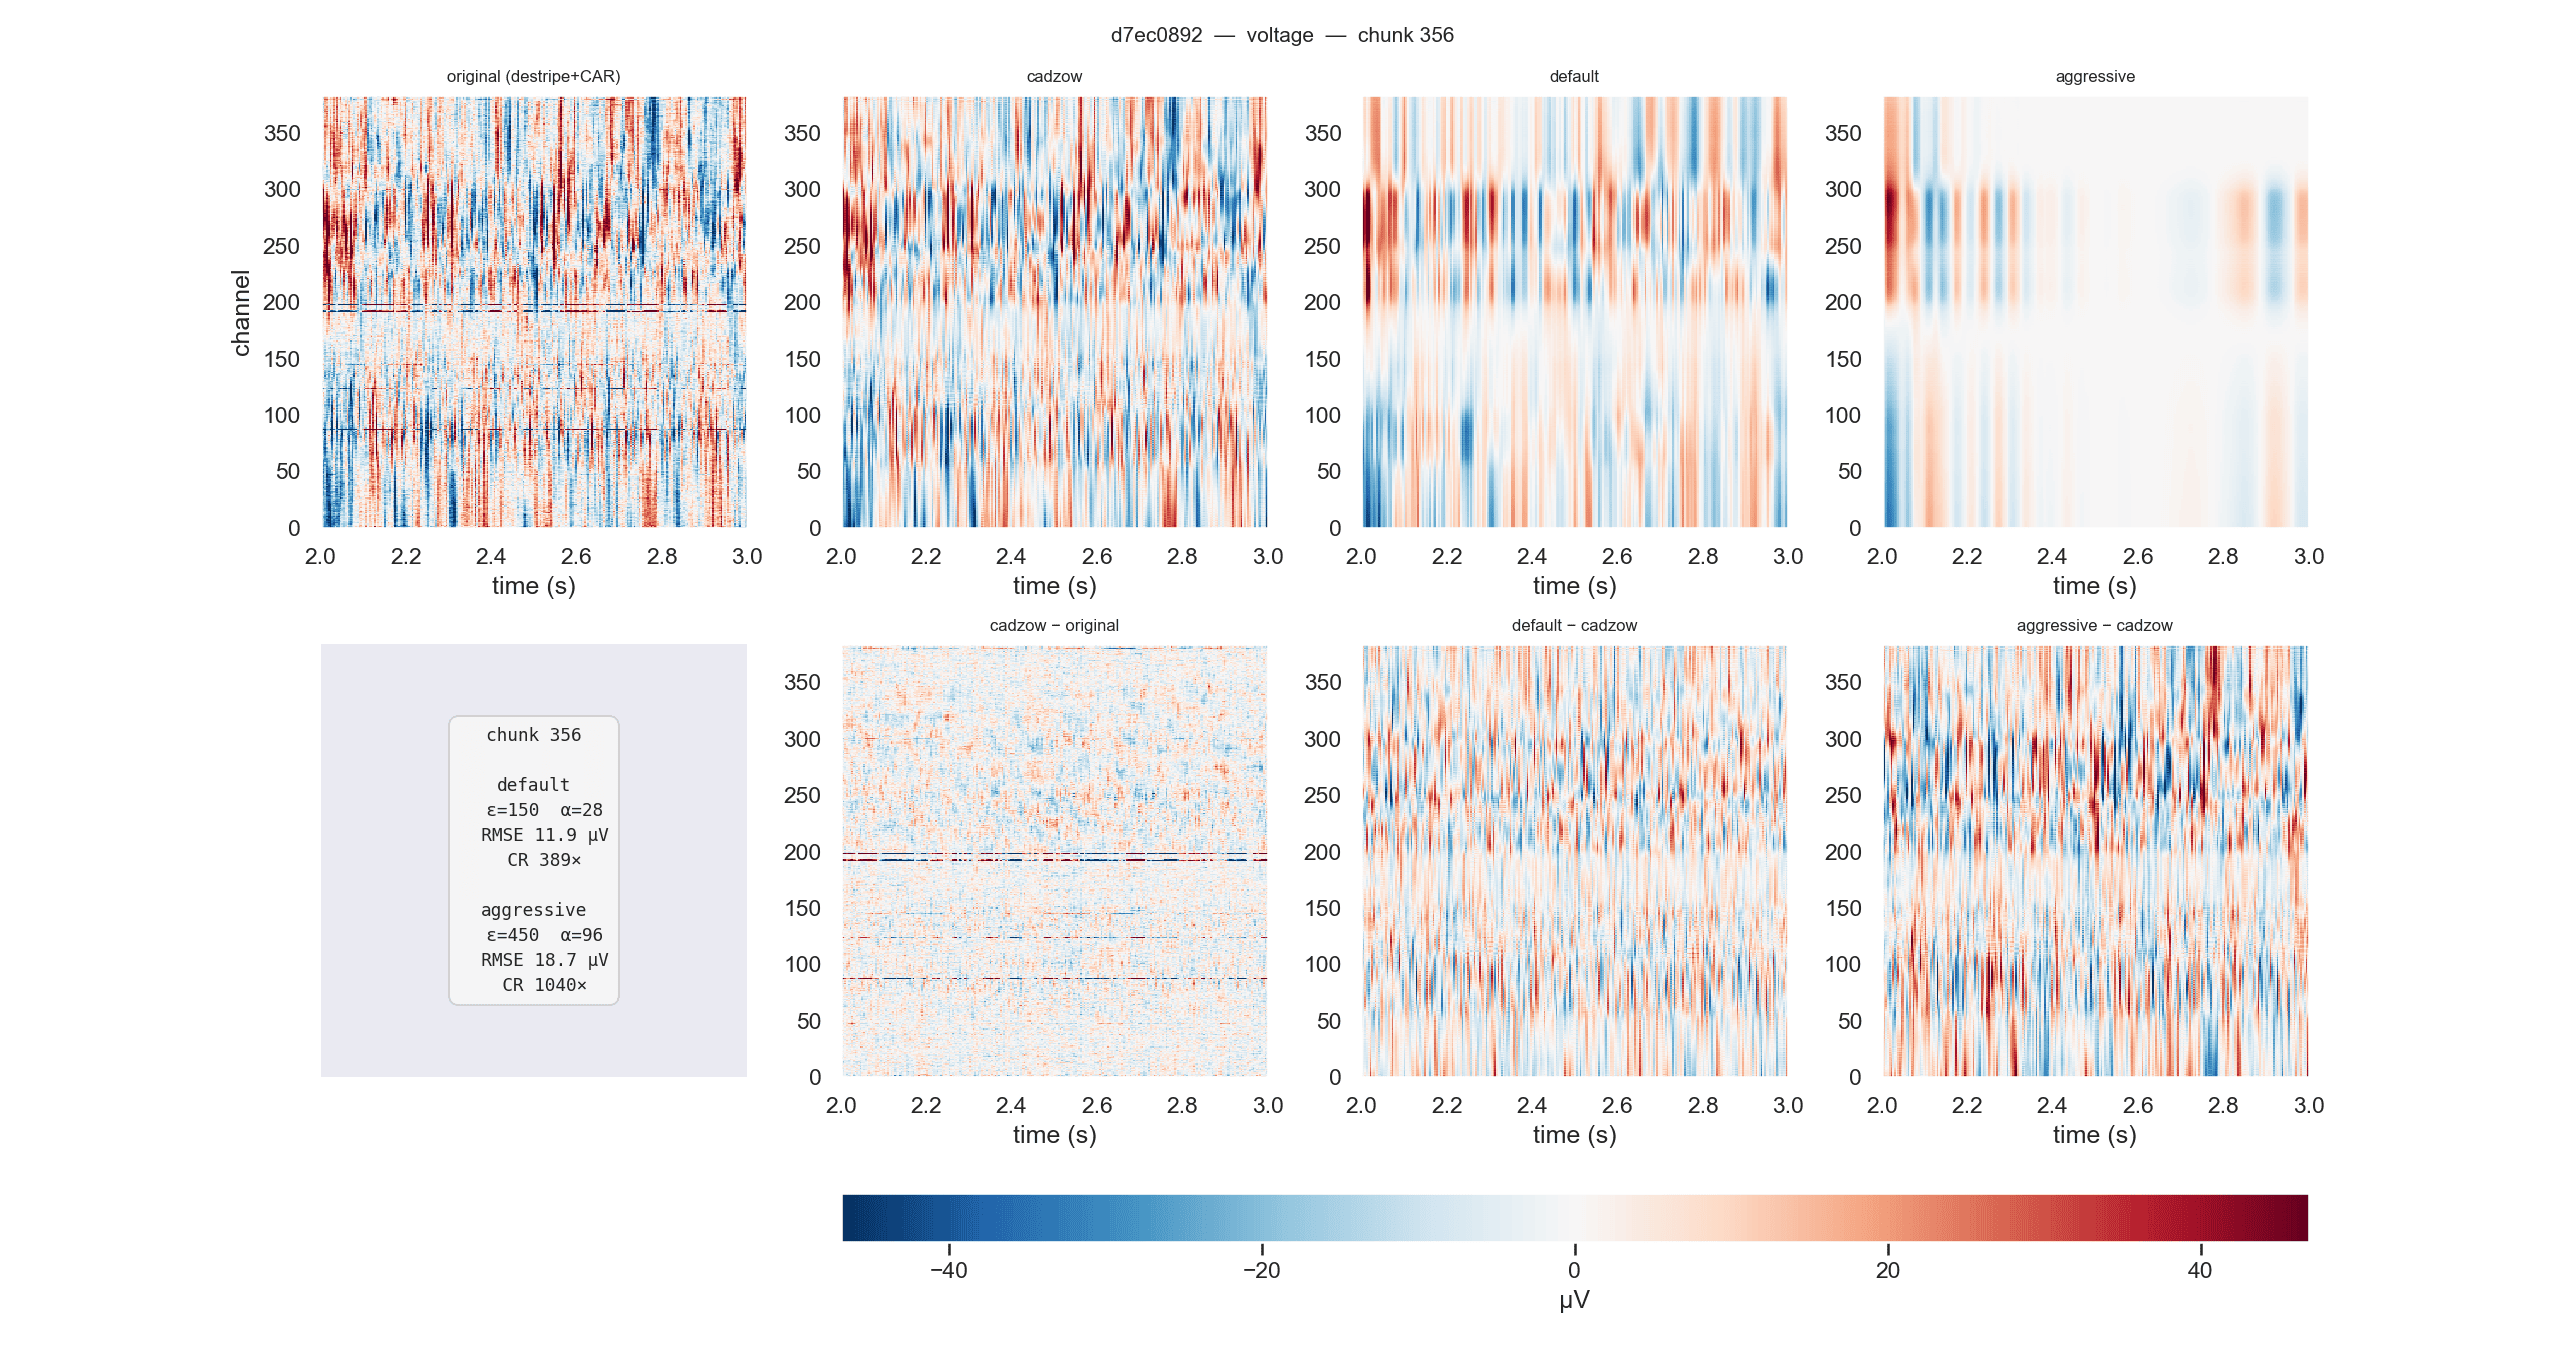
d7ec0892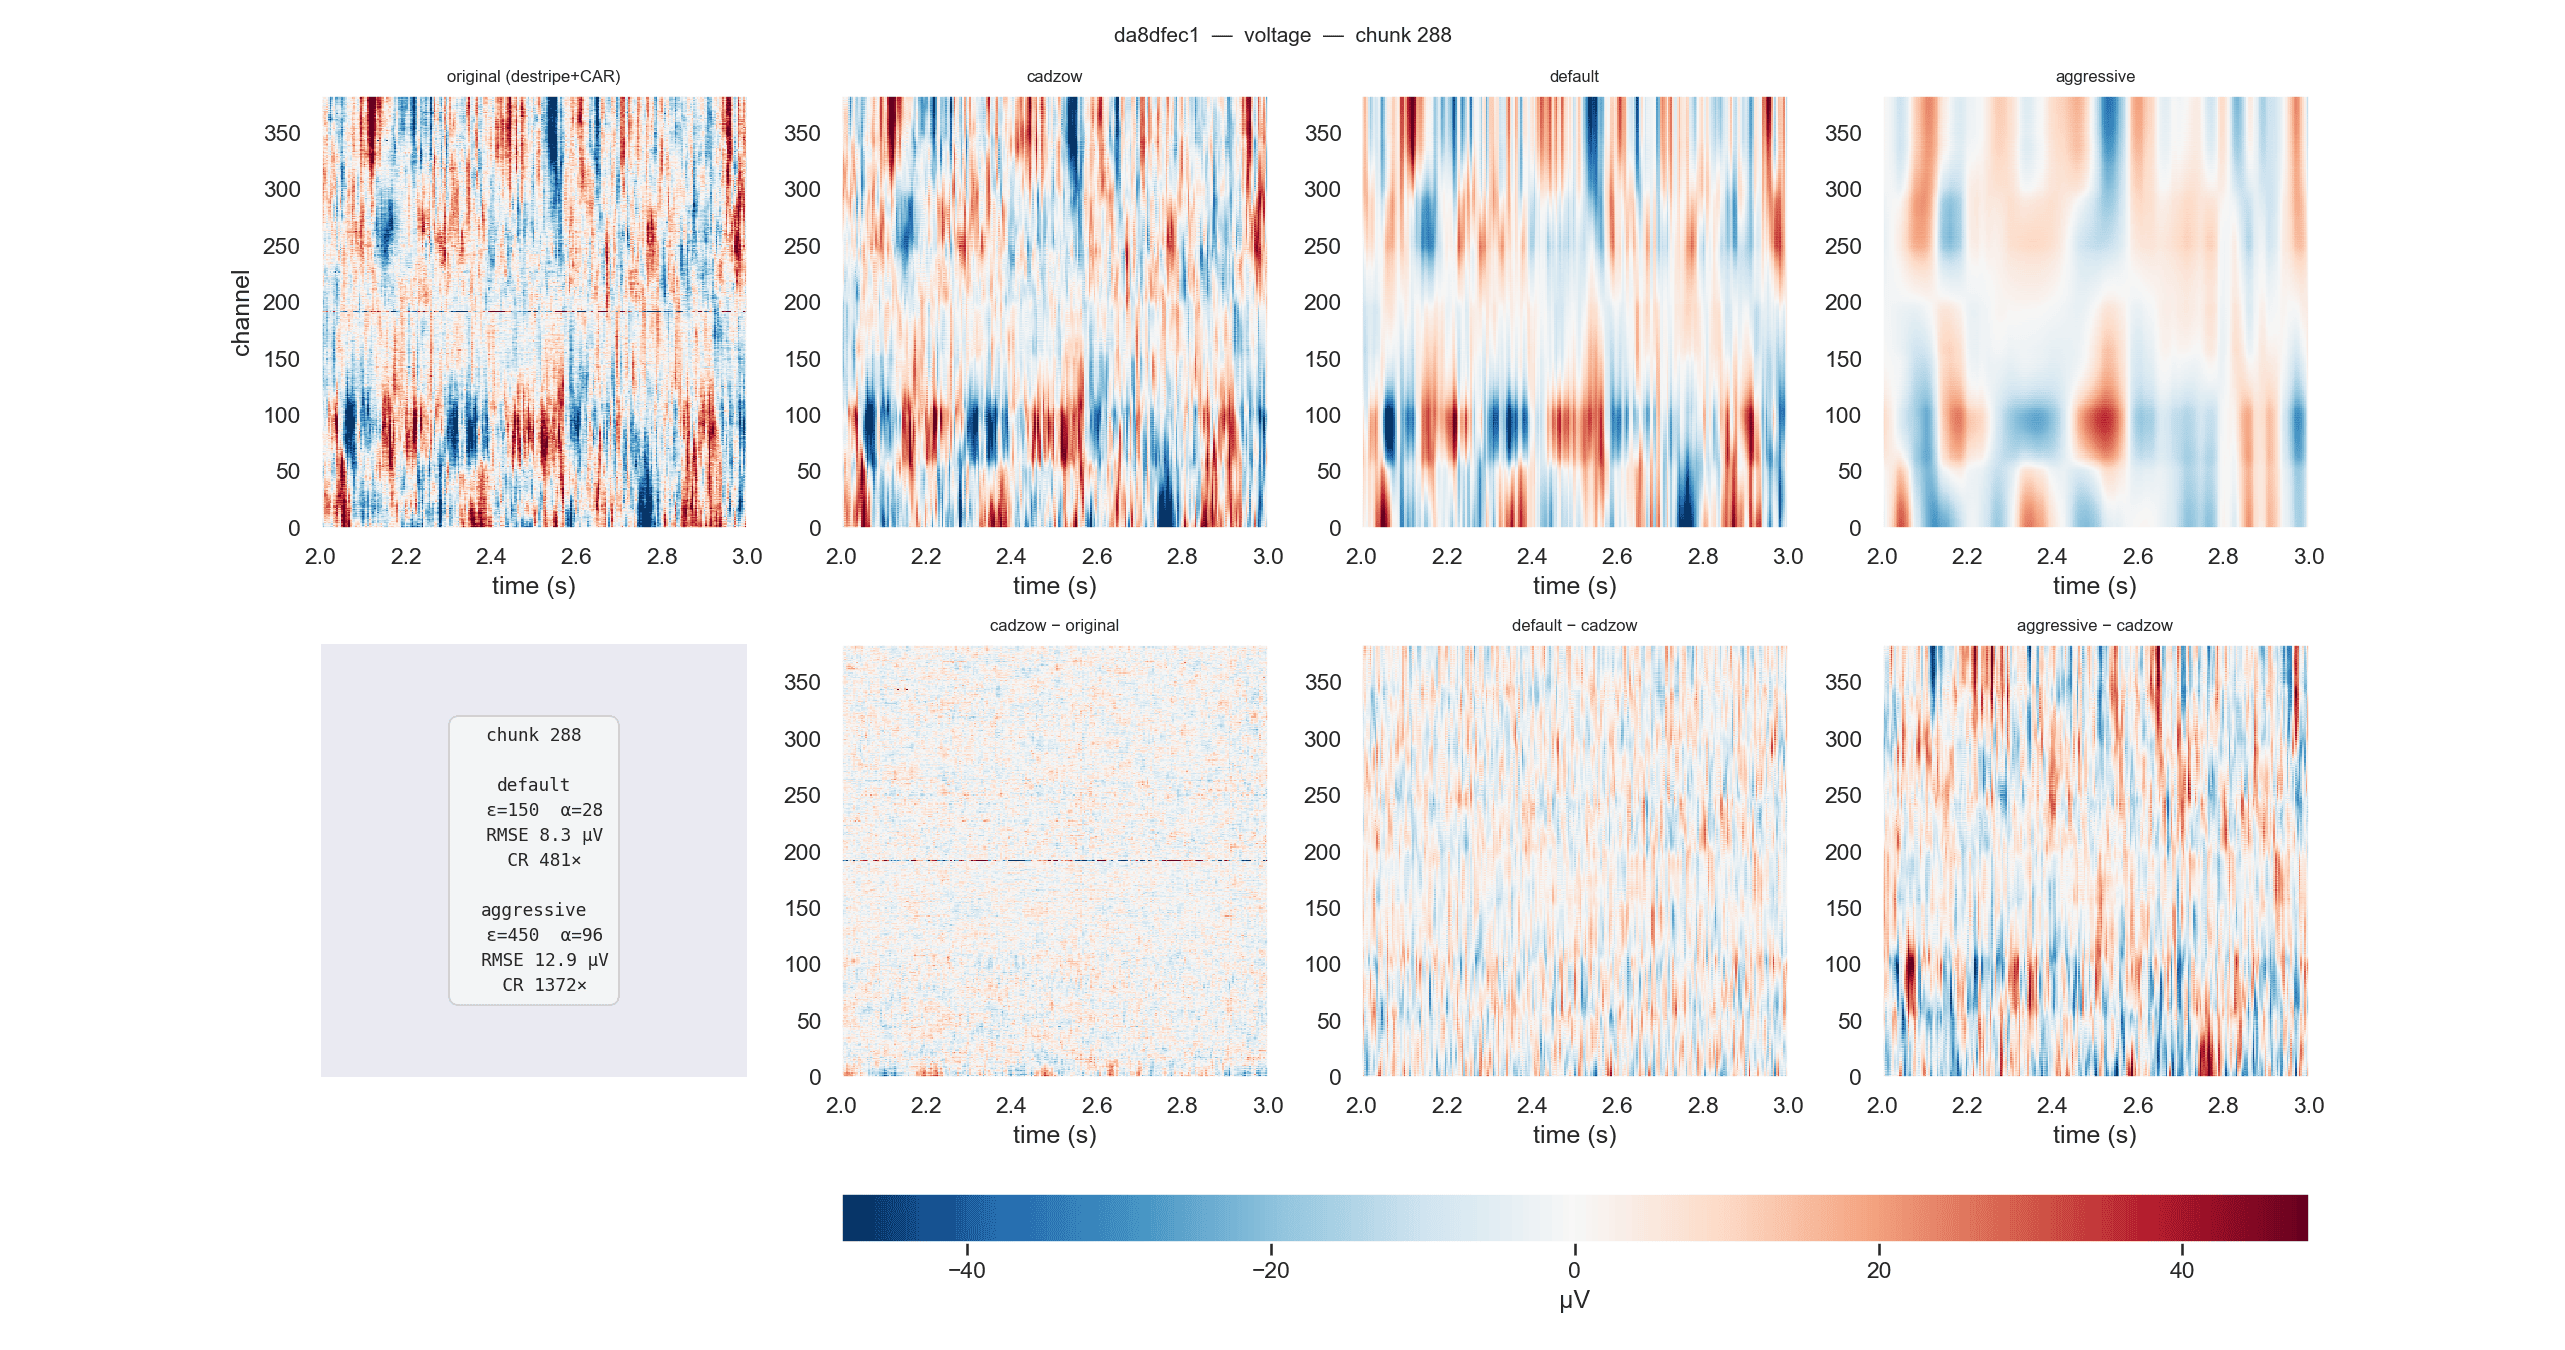
da8dfec1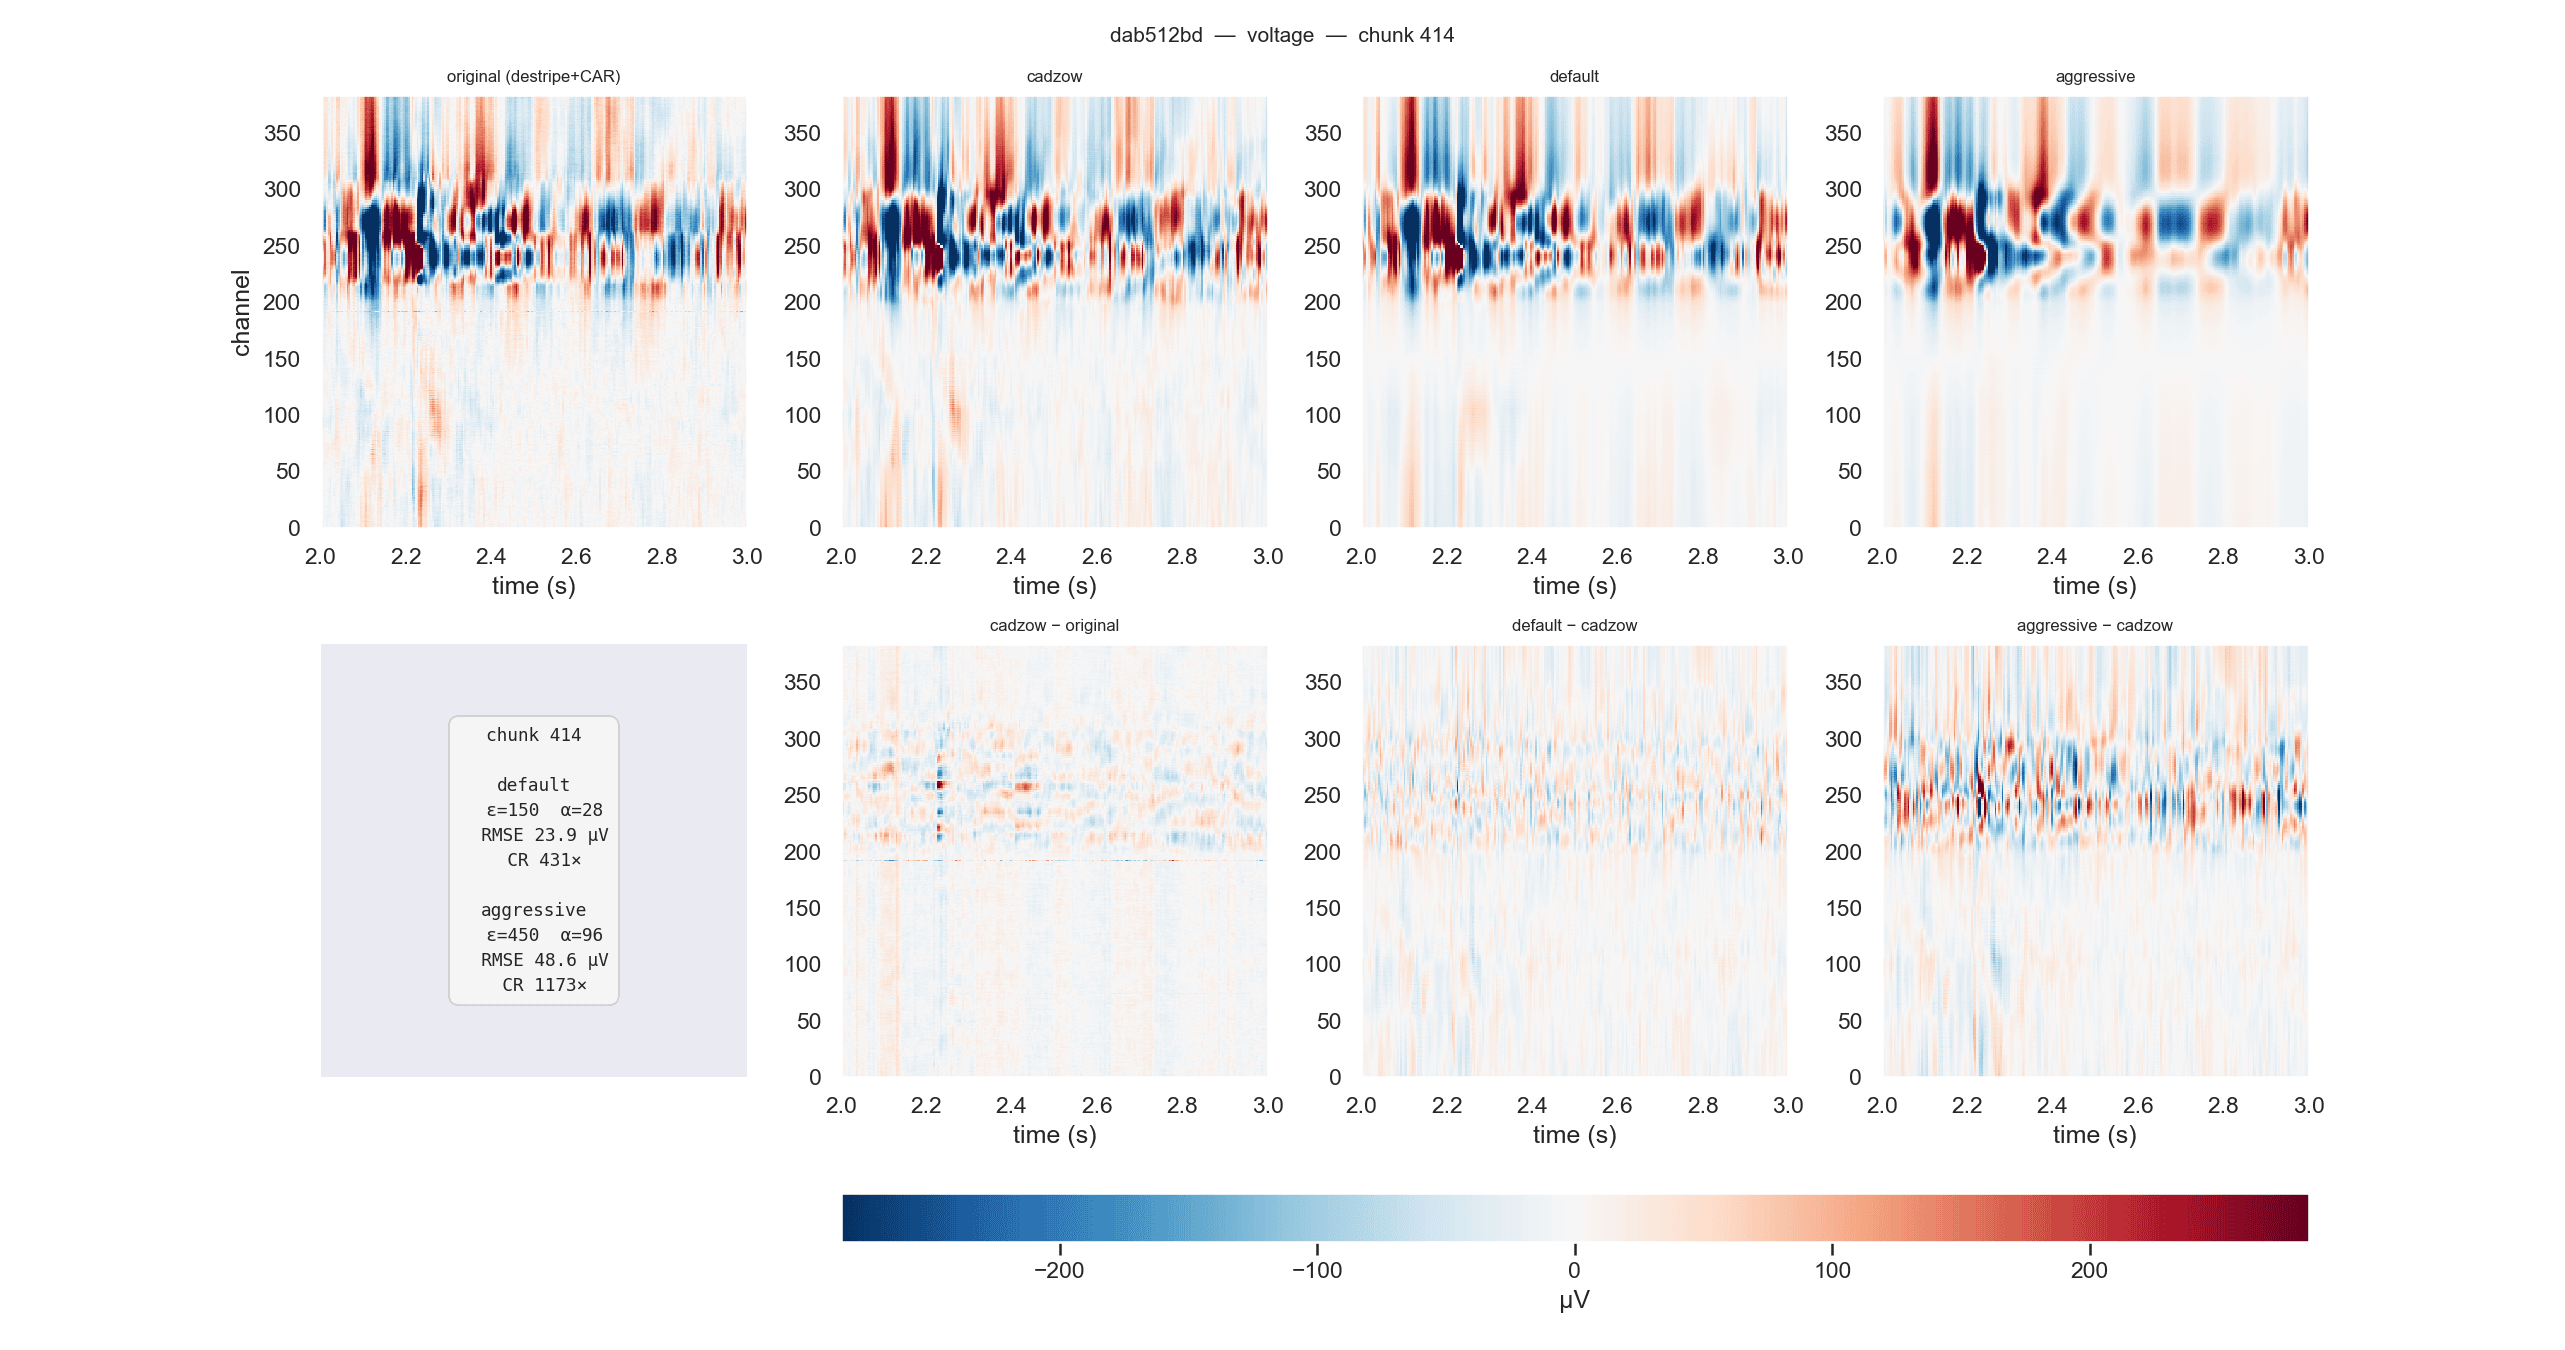
dab512bd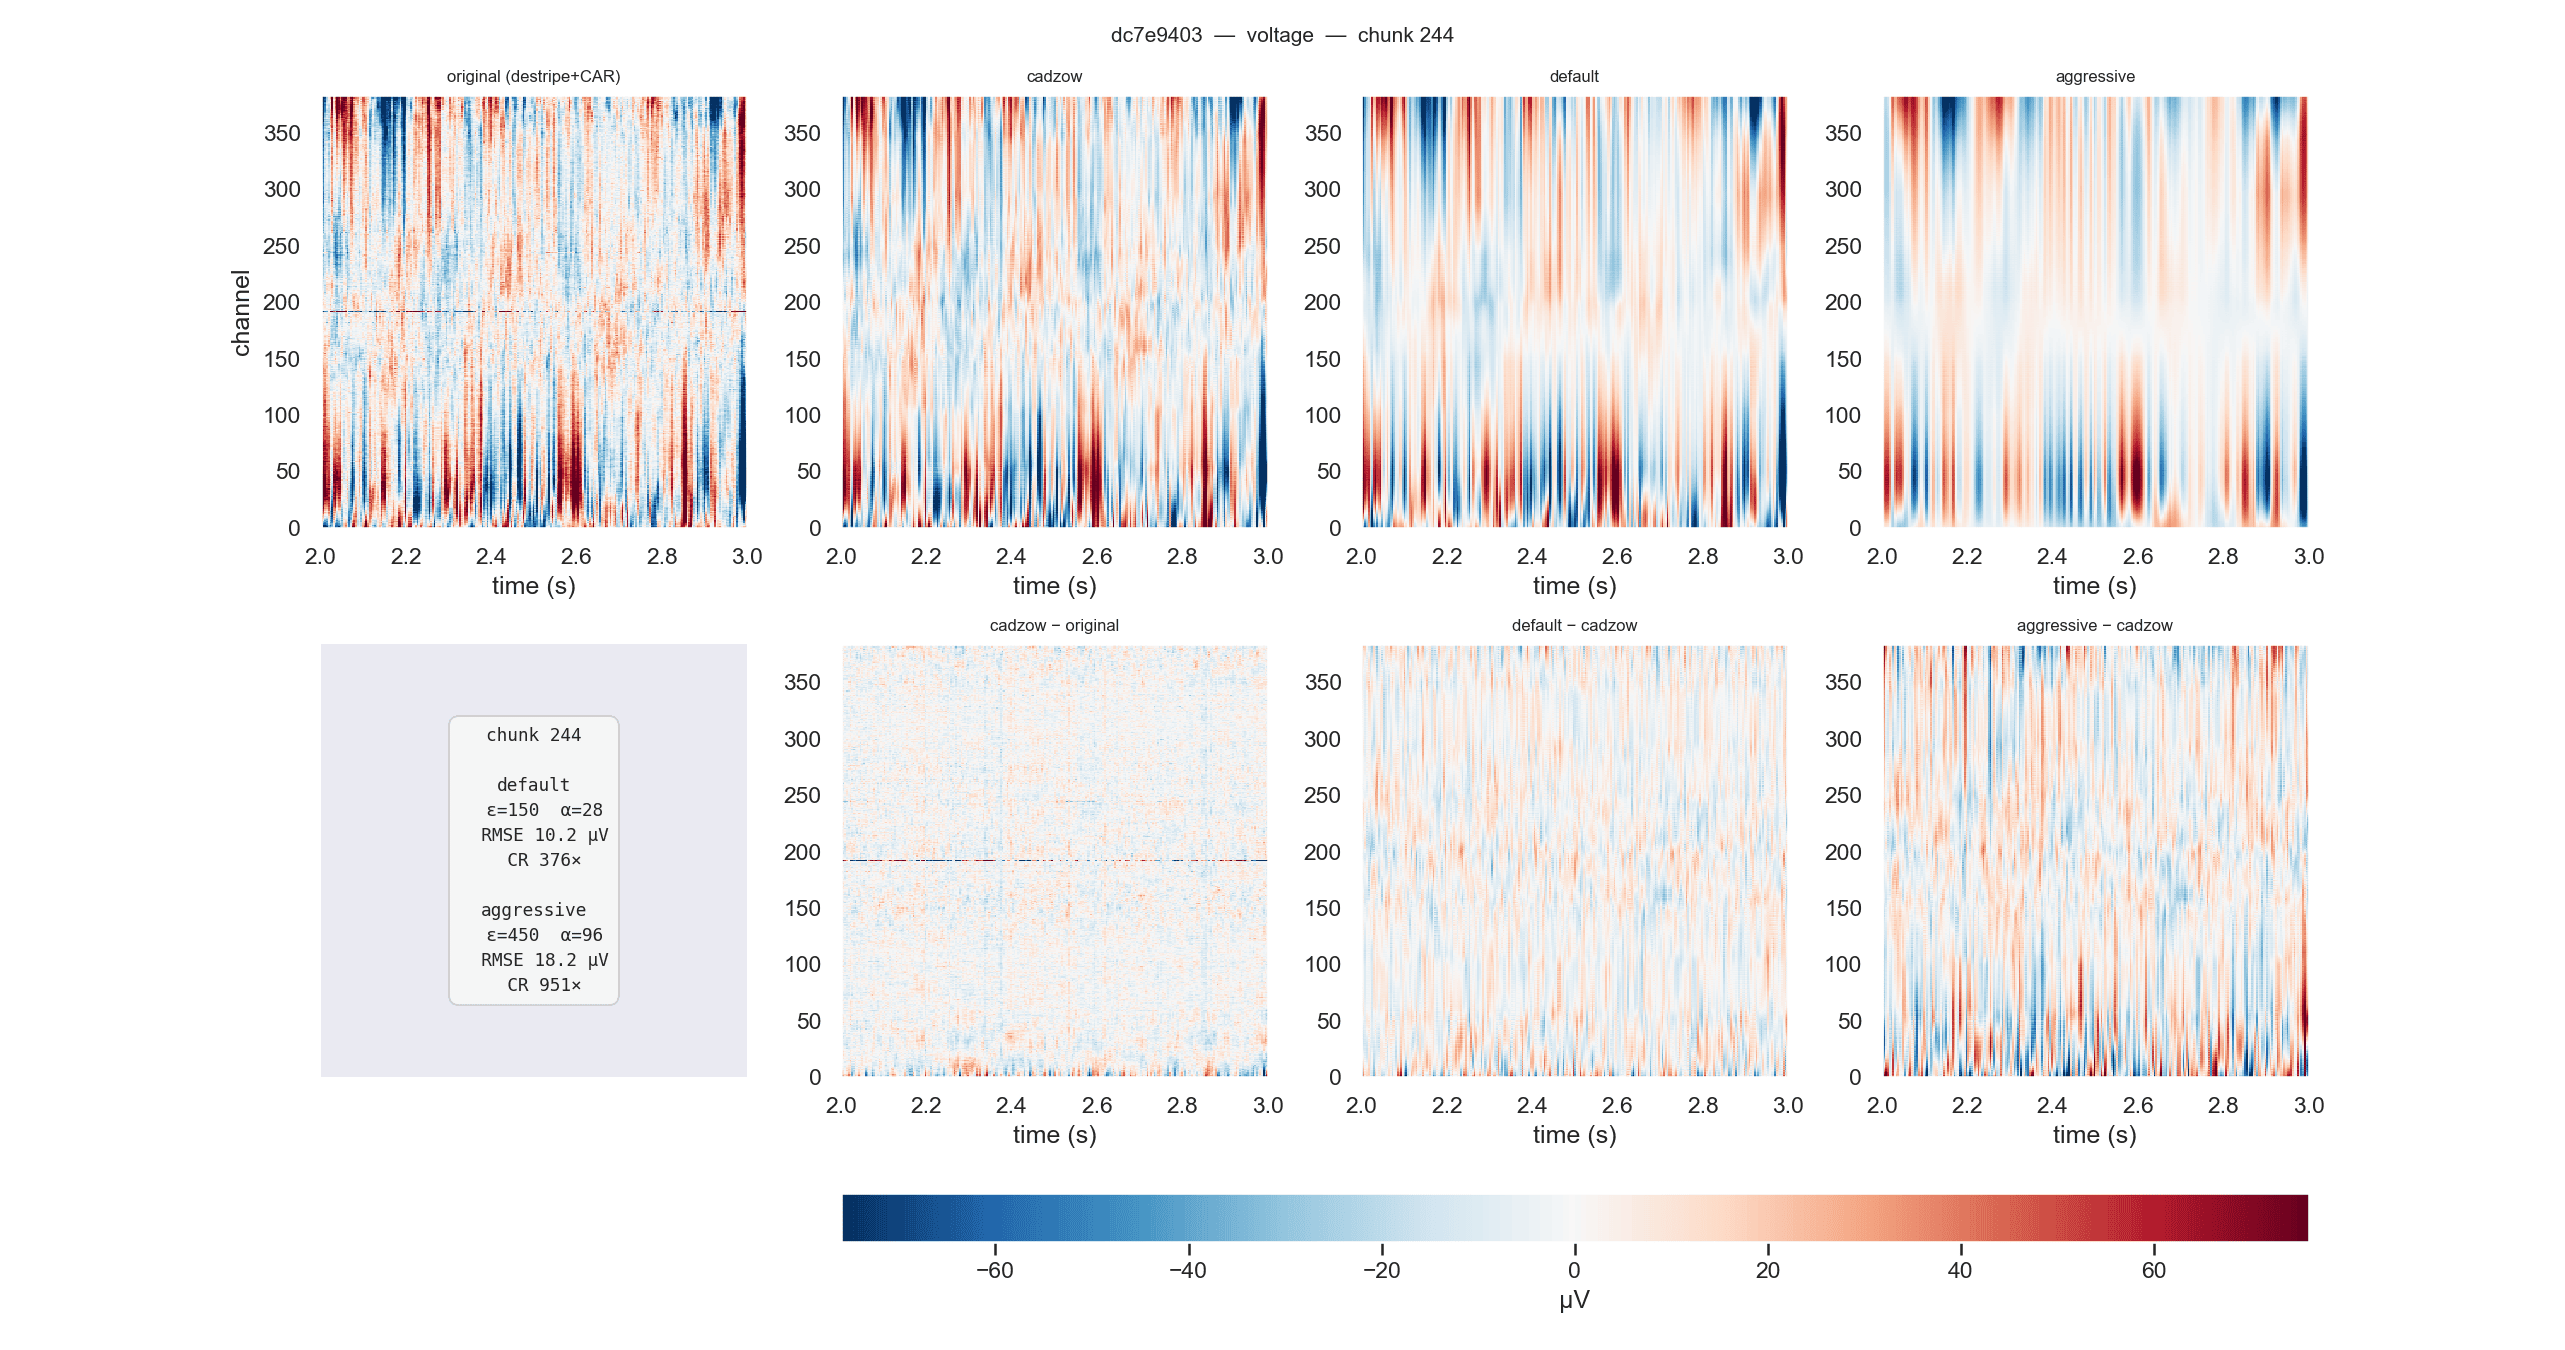
dc7e9403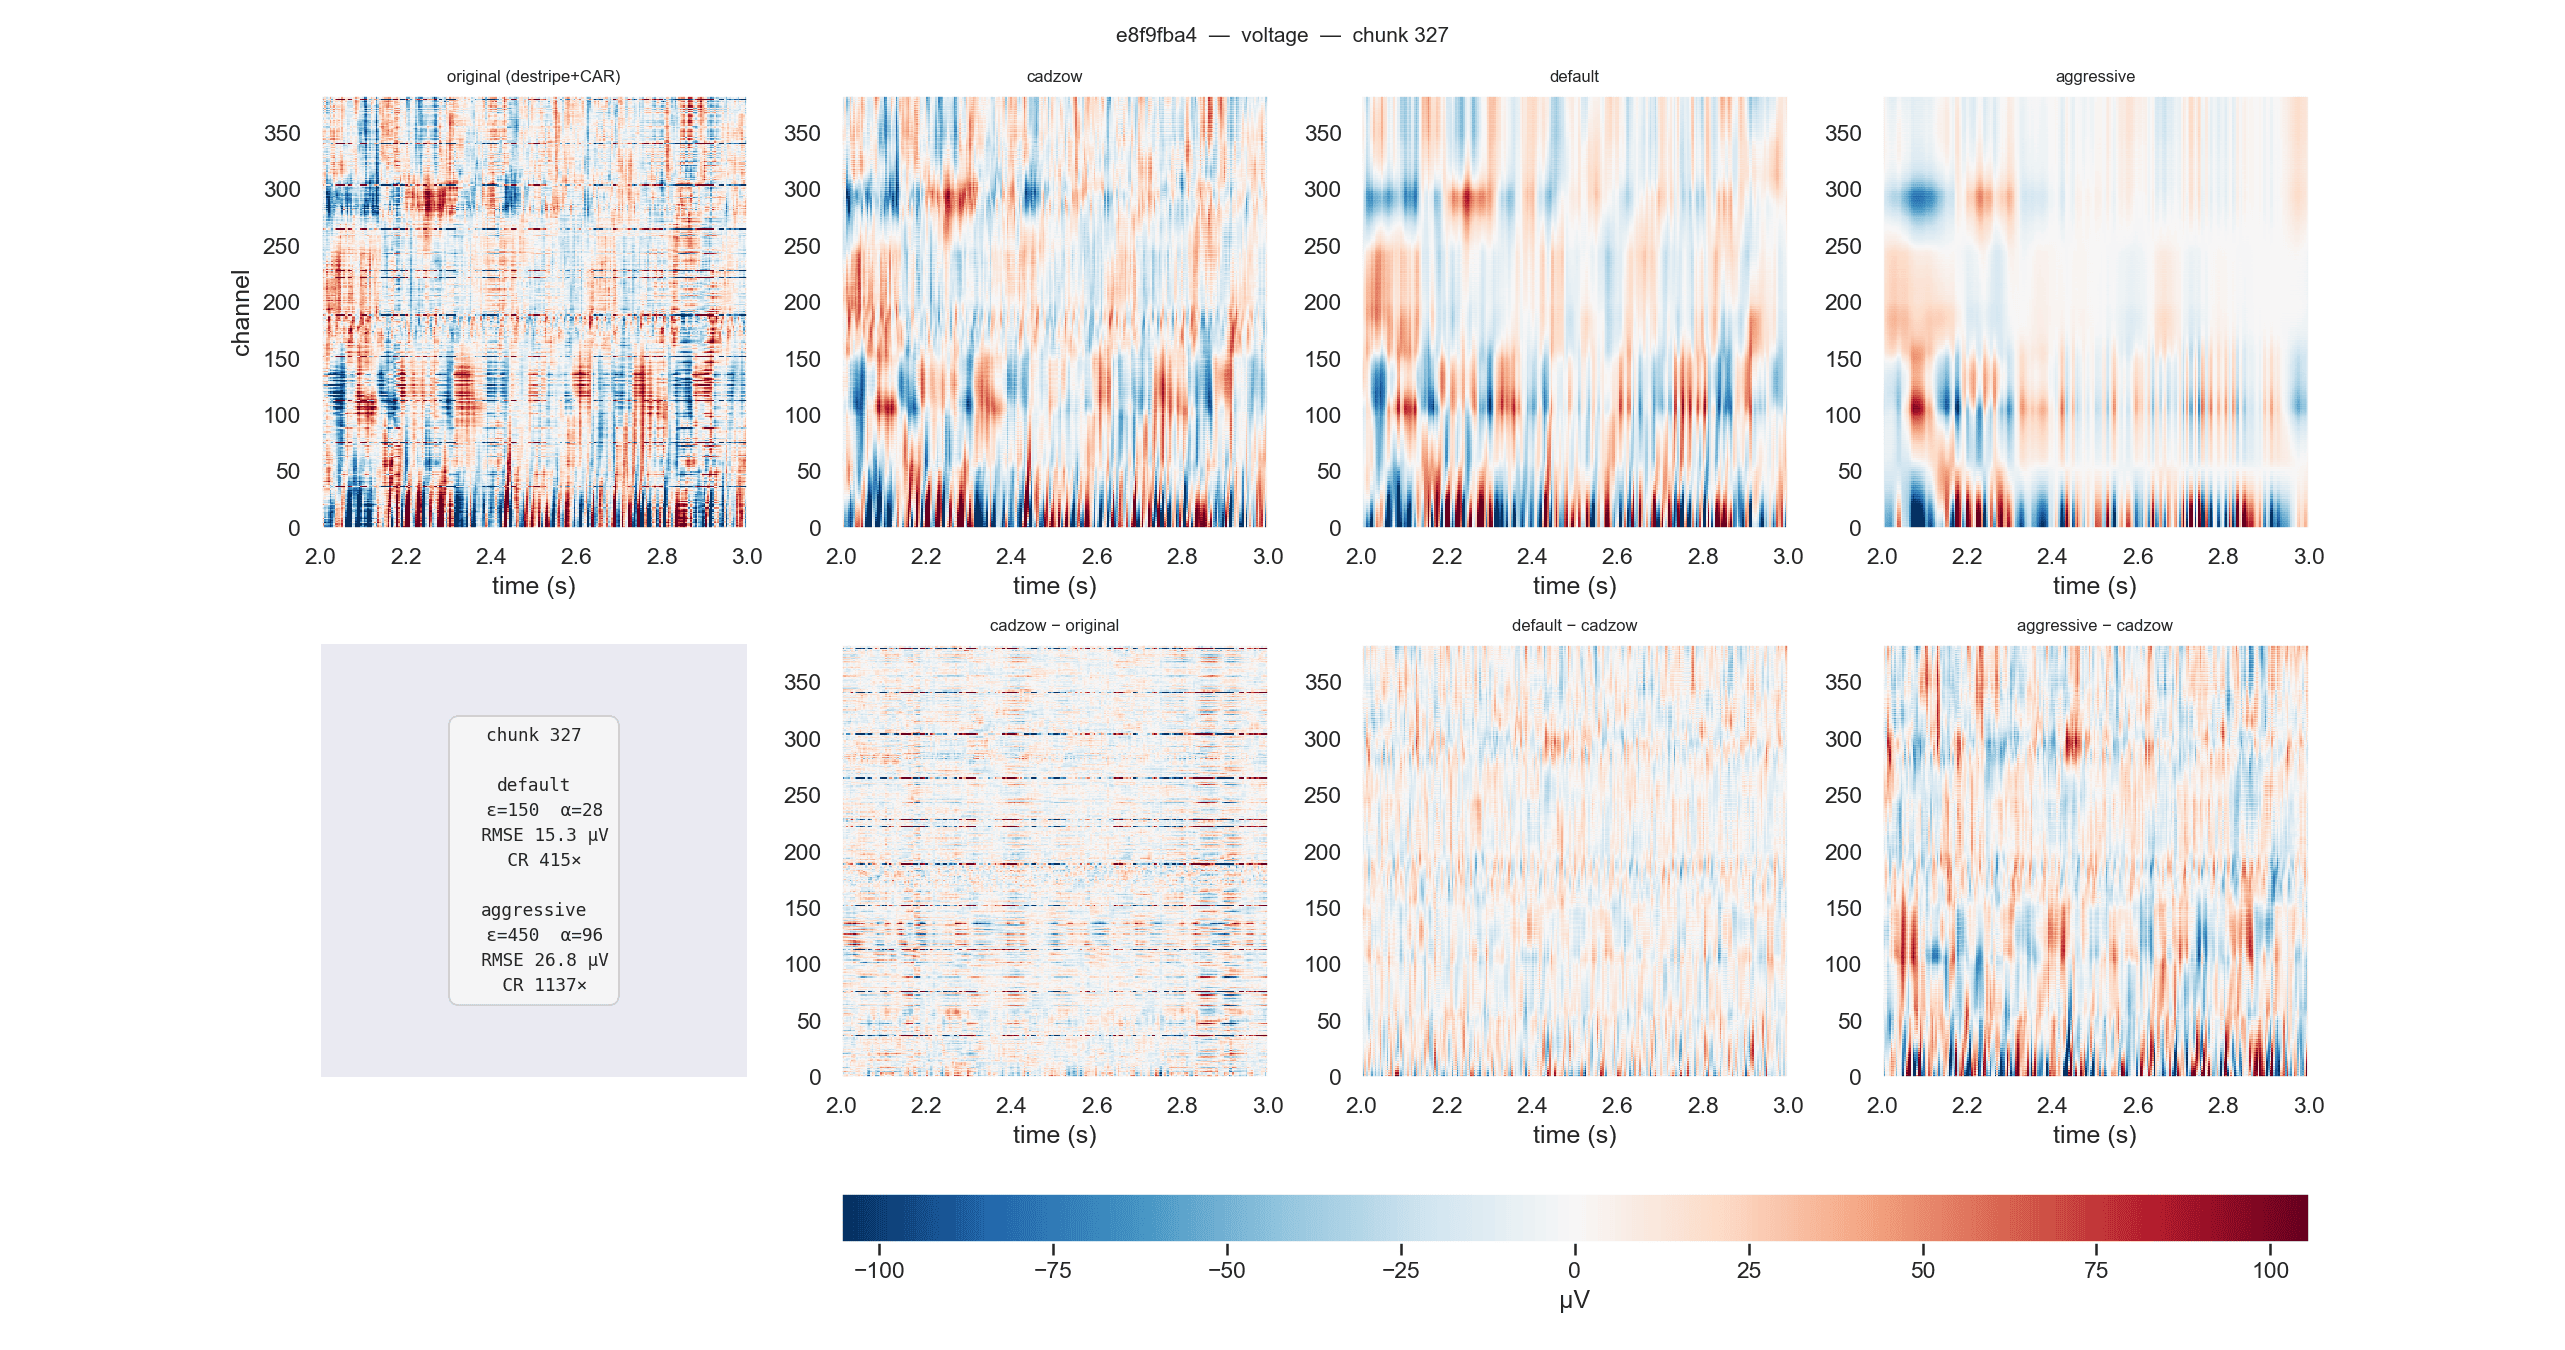
e8f9fba4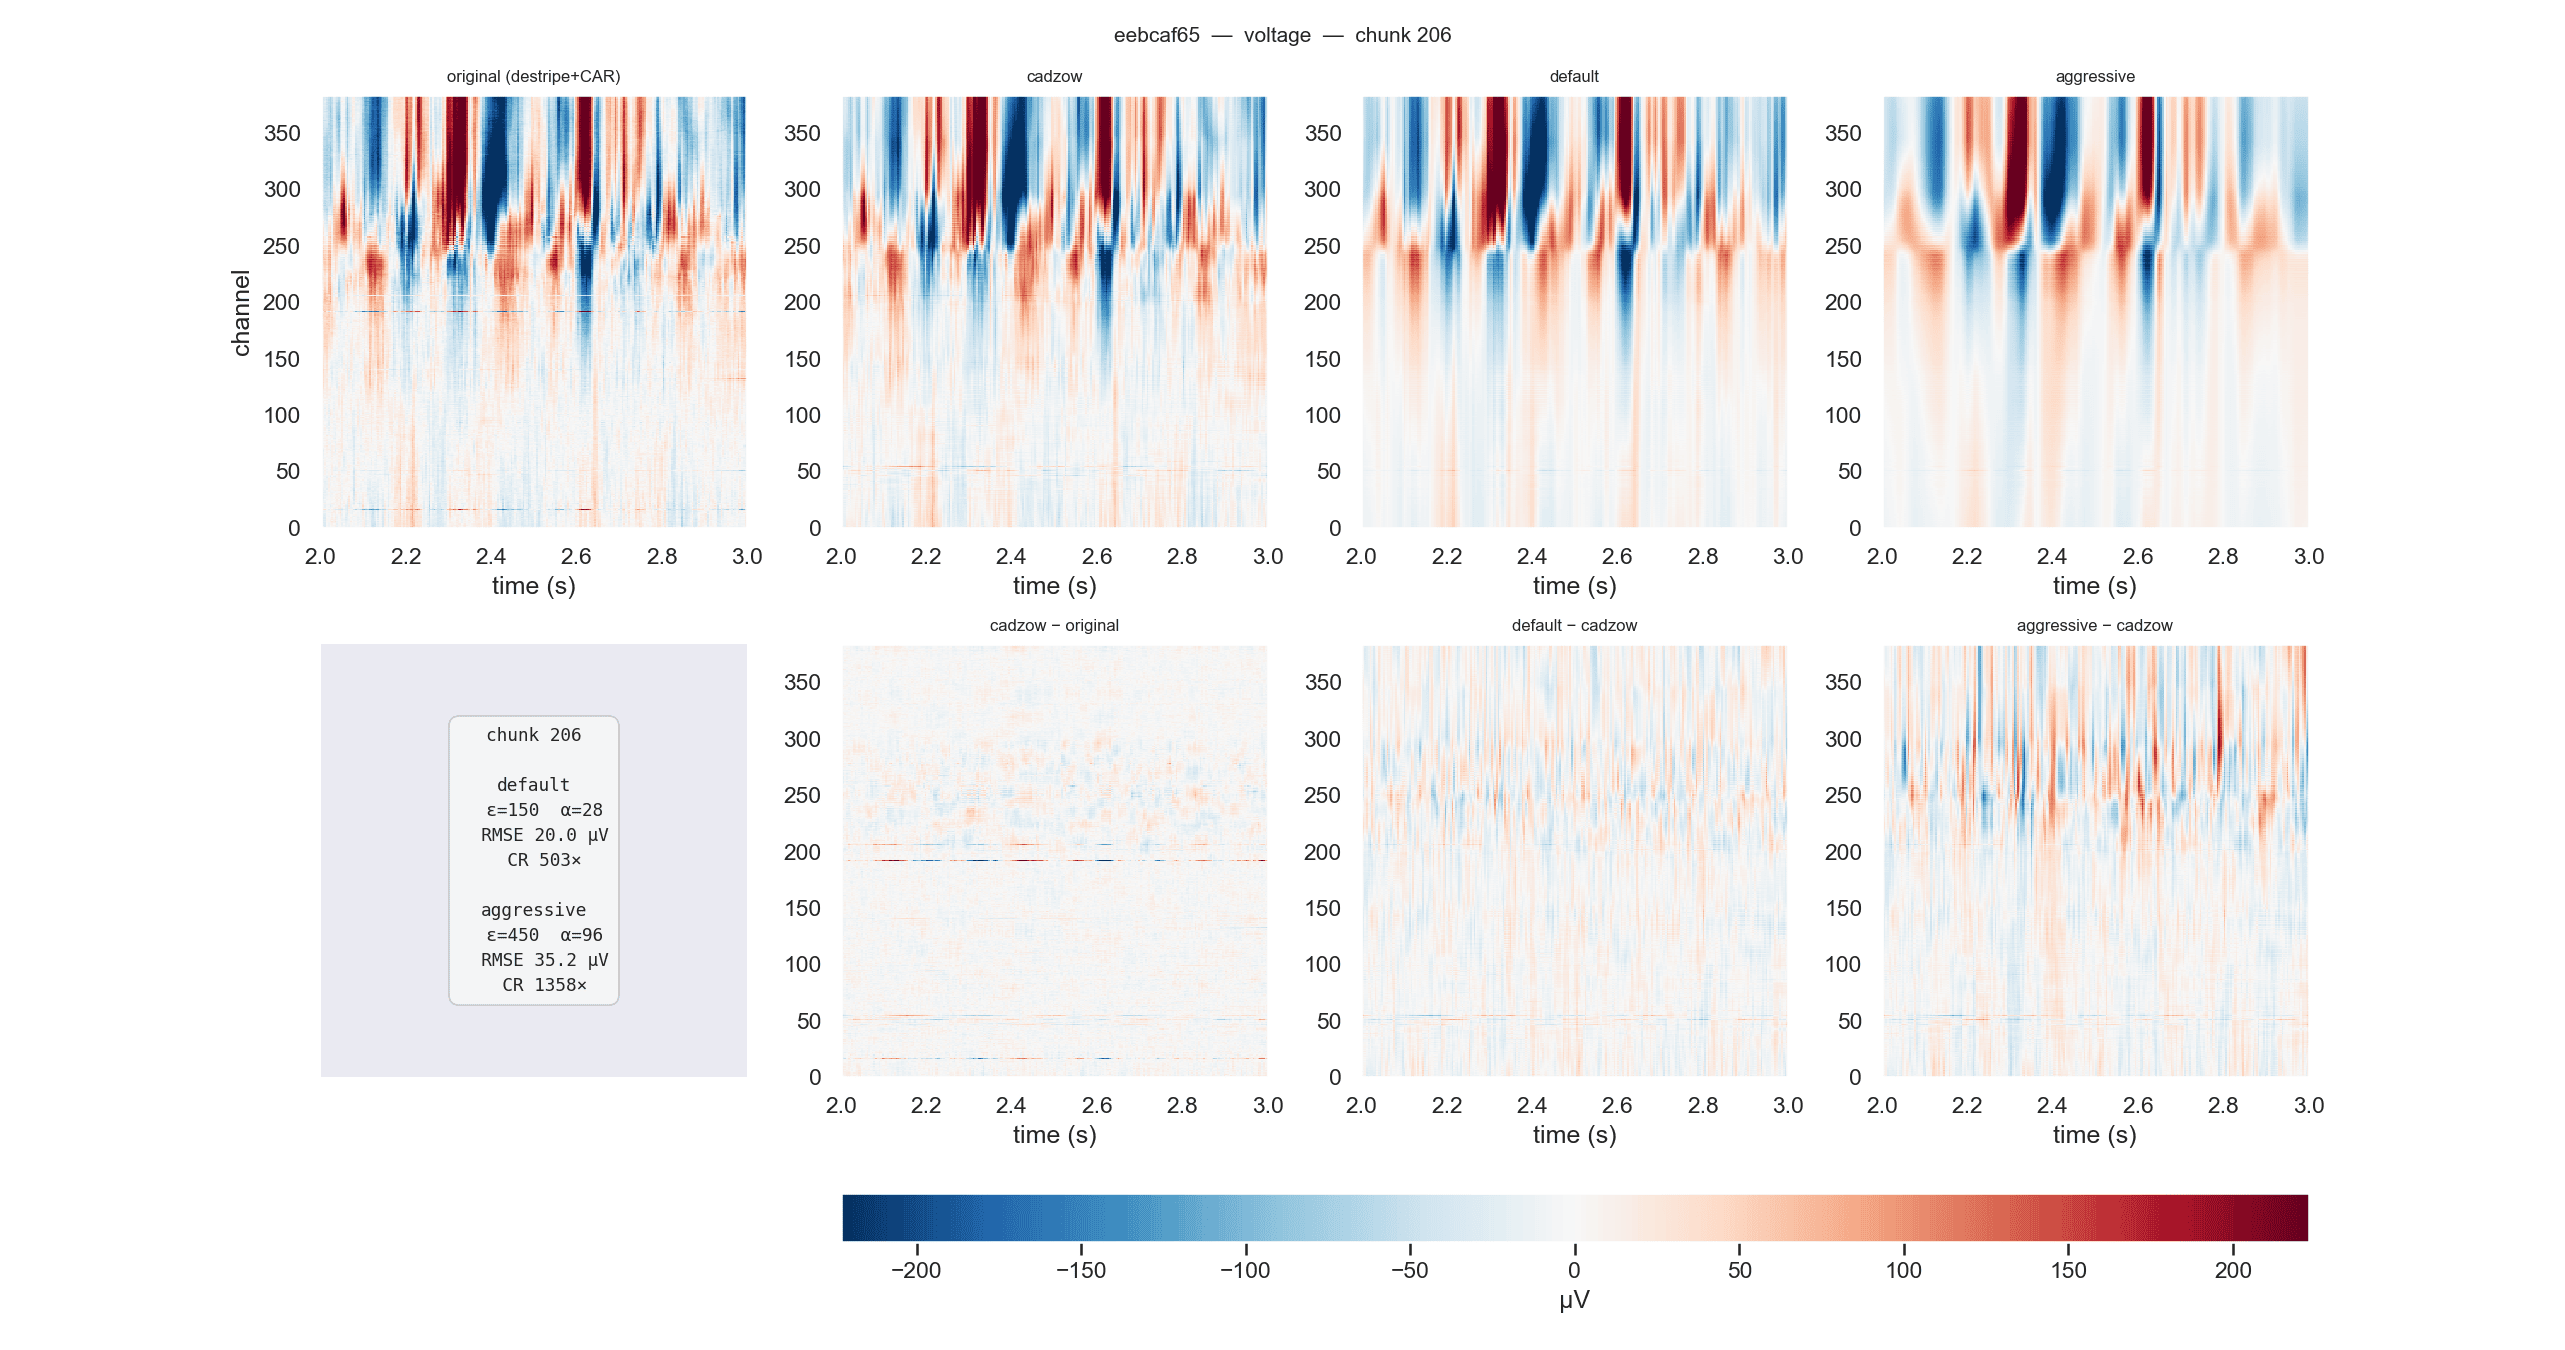
eebcaf65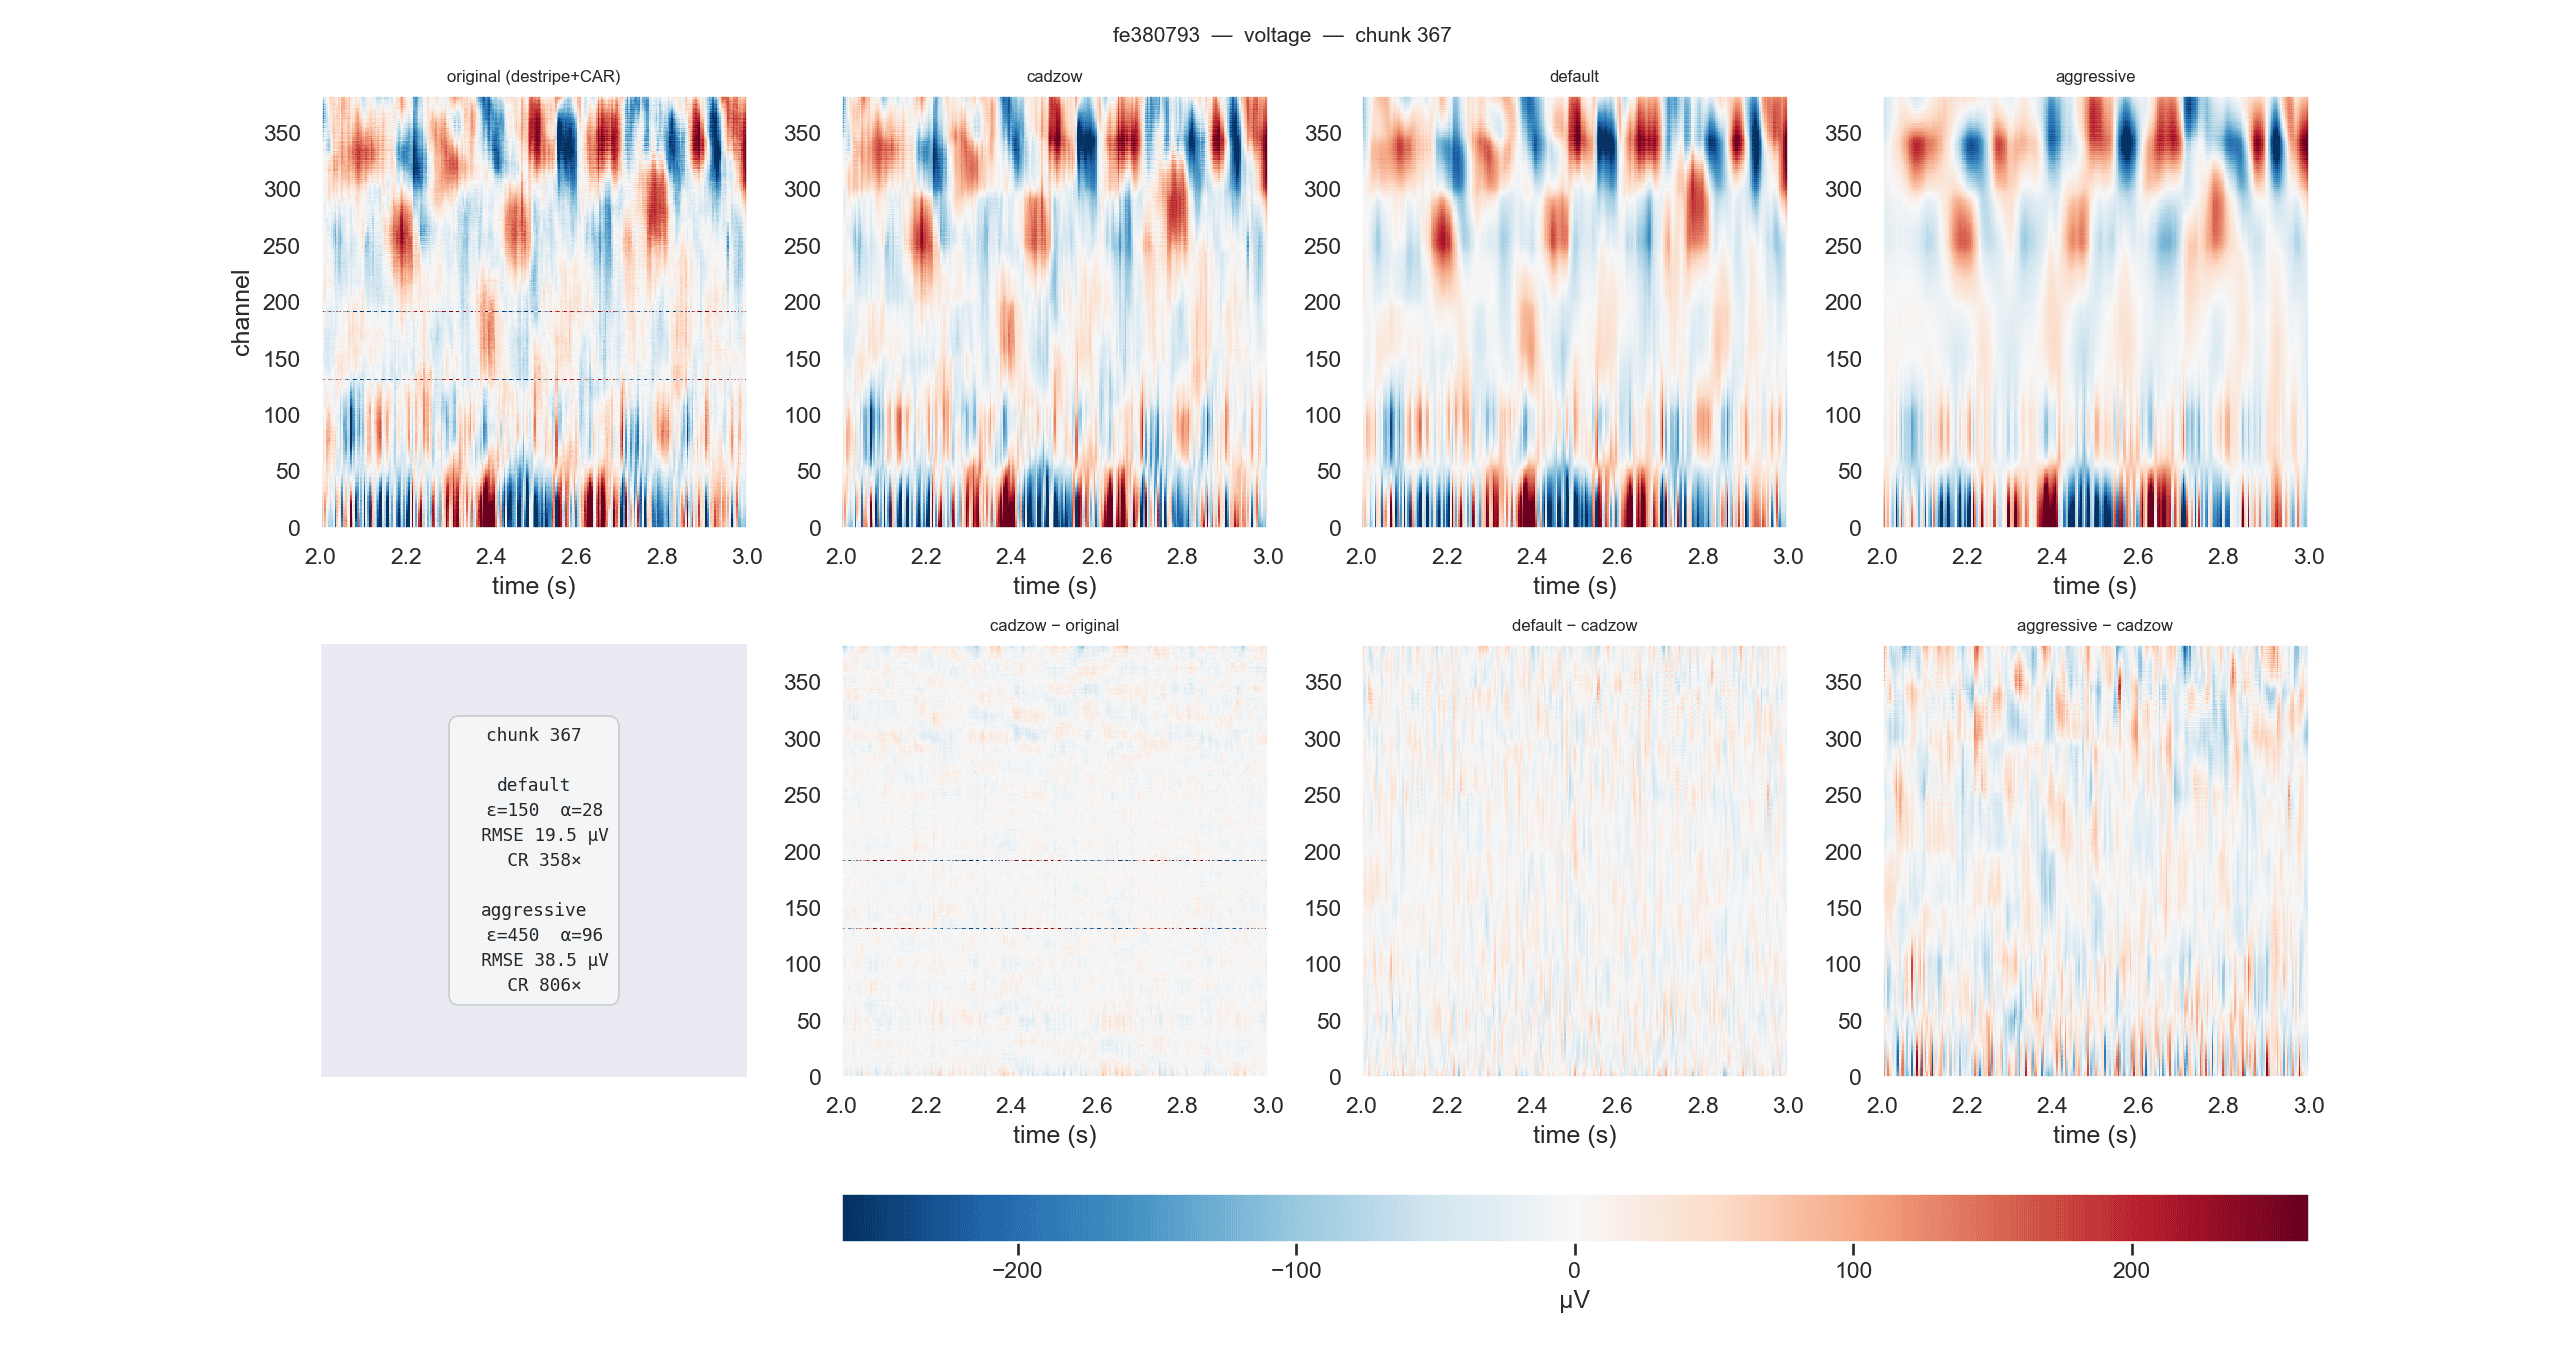
fe380793